Figure 3.
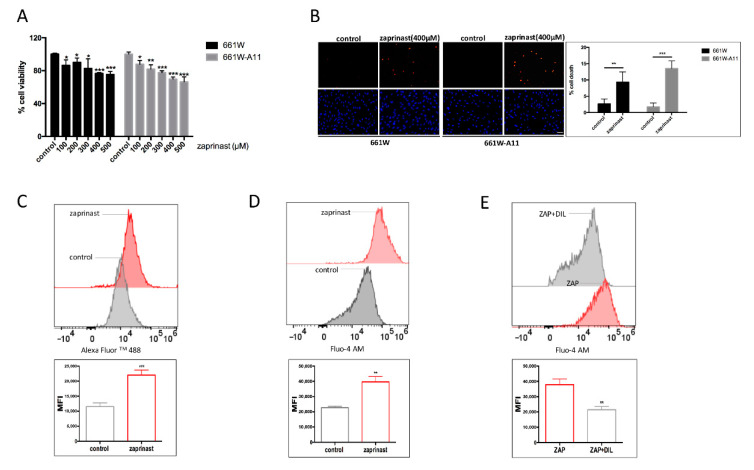
Effect of PDE6B inhibition by zaprinast treatment. (A) Cell viability assay, based on MTT, after treatment with scaling concentrations of zaprinast on 661W and 661W-A11 cells. Values of cells treated with the vehicle (0 μM, control) were set as 100% cell viability. (B) TUNEL assay detected dying cells (upper panels, red) in zaprinast-treated 661W and 661W-A11 cells; nuclei were stained with DAPI (lower panels, blue). Control shows cells treated with the vehicle (DMSO). Scale bar: 40 μm. On the right-hand side, quantifications of the TUNEL+ cells are reported. (C) Increased cGMP levels were detected by flow cytometry using an antibody (anti-cGMP) and a secondary antibody labeled with Alexa Fluor 488 in zaprinast-treated versus untreated 661W-A11 cells. Control: cells treated with the vehicle (DMSO); zaprinast: cells treated with 400 μM zaprinast for 24 h. (D) Increased Ca2+ levels were detected by flow cytometry staining with Fluo-4 AM in zaprinast-treated versus untreated 661W-A11 cells. Control: cells treated with the vehicle (DMSO); zaprinast: cells treated with 400 μM zaprinast for 24 h. (E) Decreased Ca2+ levels were detected by flow cytometry in zaprinast (+)-cis diltiazem-treated versus zaprinast-treated 661W-A11 cells. ZAP: cells treated with 400 μM zaprinast for 24 h; ZAP+DIL: cells pretreated with 50 μM (+)-cis diltiazem for 2 h and then treated with 400 μM zaprinast and 50 μM (+)-cis diltiazem for 24 h; MFI: mean fluorescence intensity. Statistical comparison: Student’s unpaired two-tailed t-test; * p < 0.05, ** p < 0.01, *** p < 0.001.

