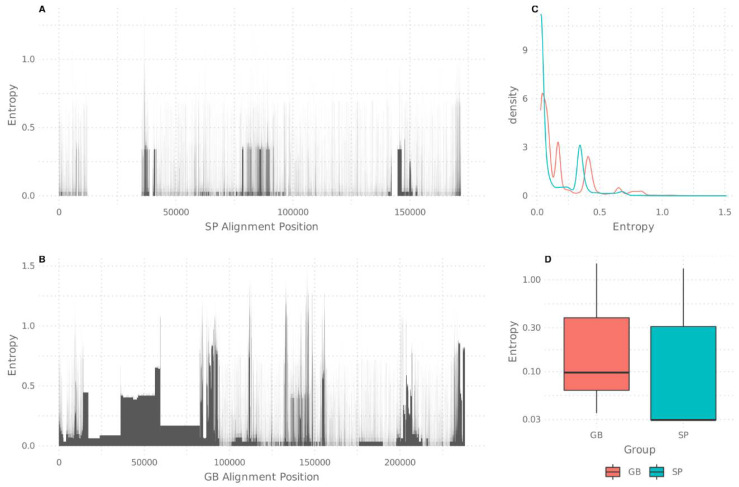
Figure 1.
Alignment entropy analysis: (A) entropic positions in the single pipeline (SP)-generated alignment; (B) entropic positions in the alignment directly generated with GenBank (GB)-downloaded sequences, for which highly entropic positions are depicted as black spikes or blocks; (C) entropy density chart for both SP and GB alignments, considering all alignment positions; (D) entropy comparison considering only positions with entropy >0, depicted in box plots.

