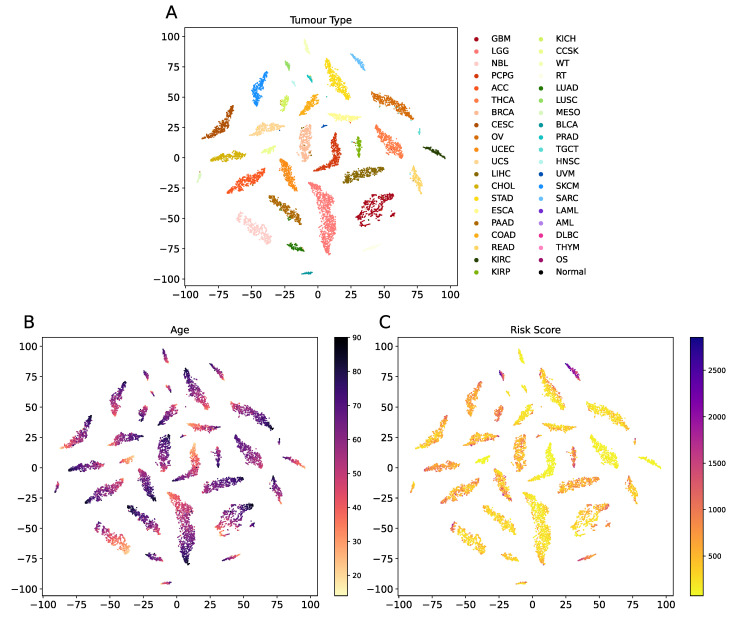
Figure 8.
Visualisation of the latent space learnt by the multi-task OmiEmbed. Each sample was colour by its tumour type (A), age (B) and risk score (C) in three corresponding scatter graphs with the same latent representation. Apparent patterns related to the three types of labels can be seen in the scatter graphs.

