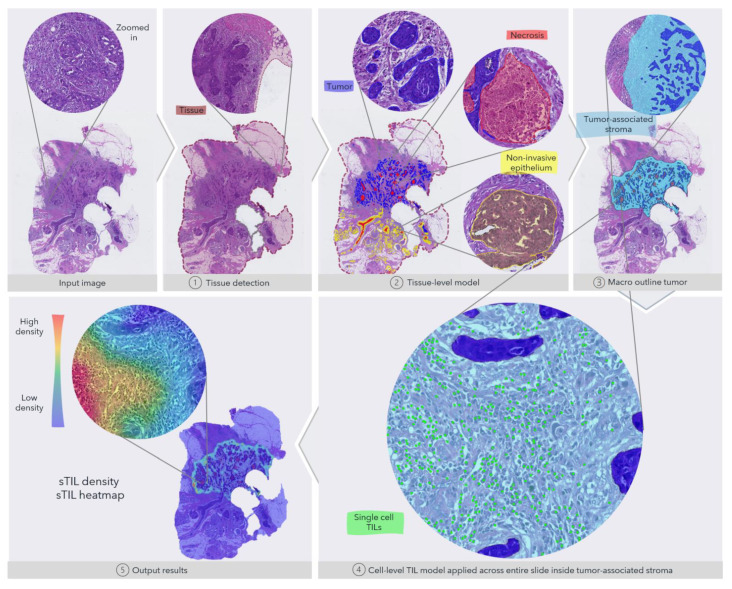
Figure 1.
Overview of the fully automated image analysis pipeline. The input data are the scanned WSI of a TNBC patient, which is then analyzed by multiple steps. First, the tissue (dark red) is recognized from the glass to limit the analysis to only the relevant part of the scanned slide. Secondly, the tissue-level model classifies slide regions into tumor tissue (blue), non-invasive epithelium (yellow), and necrotic regions (red). In the third step, the macro-outline of the tumor is approximated, and then tumor-associated stroma and margin (turquoise) are defined. Cells across the entire sample in the tumor-associated stroma are classified as TILs (green) or not, and finally, the sTIL density and heatmap can be outputted for review.

