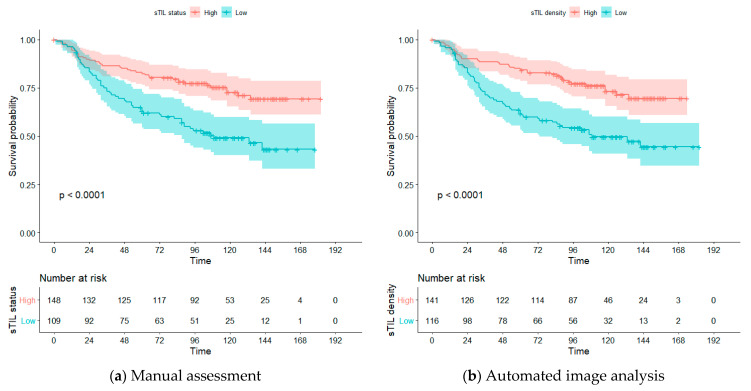
Figure 3.
Overall survival estimated by Kaplan–Meier analysis. (a) Stratification of patients into high (red) and low (blue) group using a cutpoint of >10% on the manual sTIL status. (b) stratification of patients into a high (red) and low (blue) group using a cutpoint of 470 sTIL/mm2 for the automated sTIL density.

