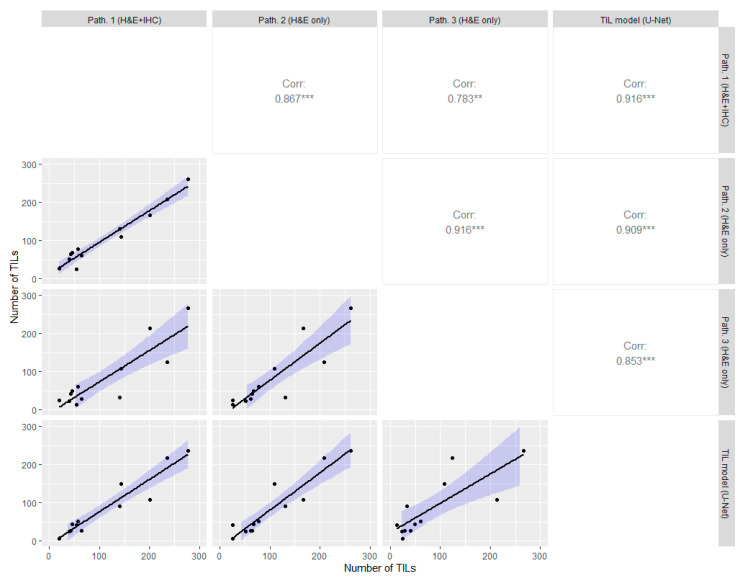
Figure 4.
Inter-method variability of cell-level discrimination of TILs between the pathologist with both H&E and IHC, the two pathologists with only H&E, and our image analysis approach on a holdout test set. The lower left of the diagonal shows the correlations plot, and the upper right shows the Spearman correlation coefficient for each comparison. The asterisks ** (p ≤ 0.01) and *** (p ≤ 0.001) indicate the significance levels of the statistical correlation test.

