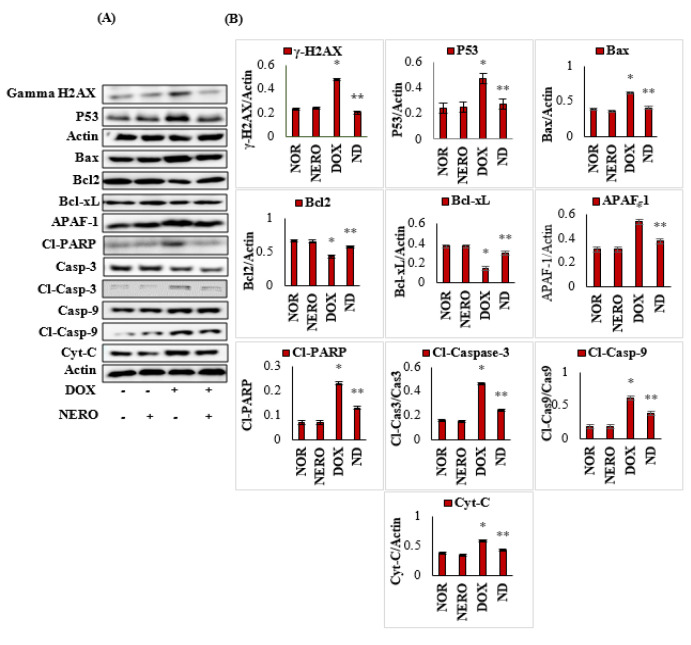
Figure 5.
(A,B). Representative images of Western immunoblot analysis and densitometry for γ-H2AX, P53, Bax, Bcl2, Bcl-xL, active caspase-3, active caspase-9, APAF-1, cleaved PARP, and cytochrome-C. The values are expressed as the mean ± SEM (n = 3); columns do not share a common symbol (*, **) and differ significantly with each other (* p < 0.05 vs. normal control, ** p < 0.05 vs. DOX control). H2AX- H2A histone family member X; Bcl-2- B-cell lymphoma 2; Bax- Bcl2-associated-X- protein; Bcl-xL- B-cell lymphoma extra-large; P53- tumor protein; APAF-1- apoptotic protease activating factor 1; Cyt-C- cytochrome-C; CL-PARP-cleaved poly (ADP-ribose) polymerase; Casp-3-caspase 3; Cl-Casp-3- cleaved caspase-3; Casp-9-caspase 9; Cl-Casp-9- cleaved caspase-9; NOR-normal; NERO-nerolidol; DOX- doxorubicin; ND- rats administered with a single intraperitoneal dose of DOX and orally treated with NERO.

