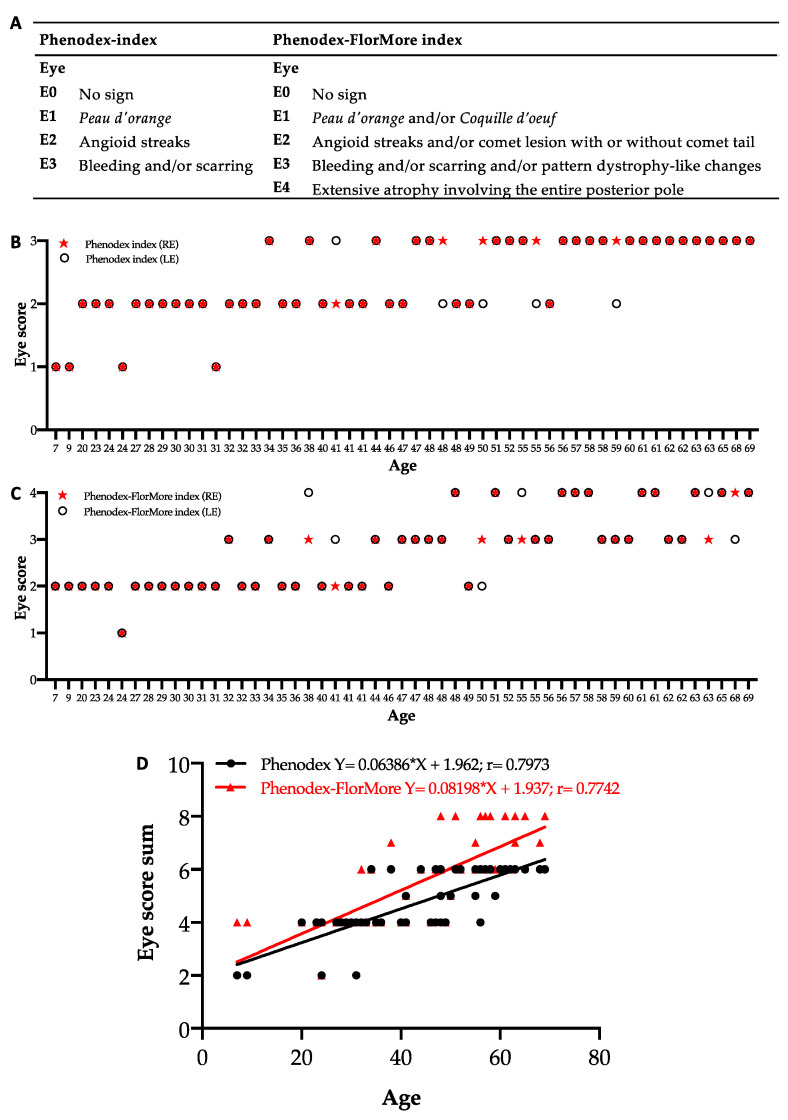
Figure 7.
(A) Eye score according to the Phenodex or Phenodex-FlorMore index, respectively. (B,C) Graphs show the right (RE) and left (LE) eye score of each patient according to the Phenodex or Phenodex-FlorMore index, respectively. (D) Scatter diagrams and linear regression analysis of the sum of eye scores in PXE patients according to the Phenodex and Phenodex-FlorMore index.

