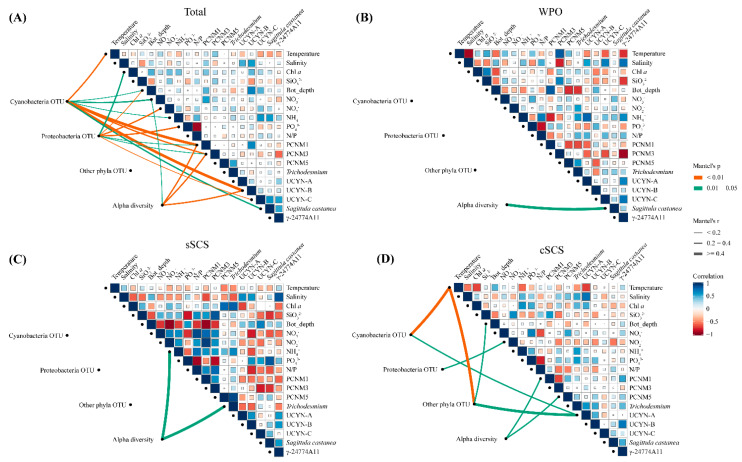
Figure 6.
Mantel tests and Spearman’s correlation matrix among diazotrophic communities and environmental parameters in the total survey area (A), the WPO (B), the sSCS (C), the cSCS (D). Pairwise comparisons between environmental factors and gene copies of representative genera phylotypes (qPCR) are shown with a color gradient denoting Spearman’s correlation coefficient. The composition of diazotrophic communities (OTUs) was related to environmental parameters using Mantel tests to determine the Distribution of diazotrophs. Edge width corresponds to the Mantel’s r statistic for the corresponding correlations, and edge color denotes the statistical significance of Mantel’s p. The insignificant correlations were not be displayed.

