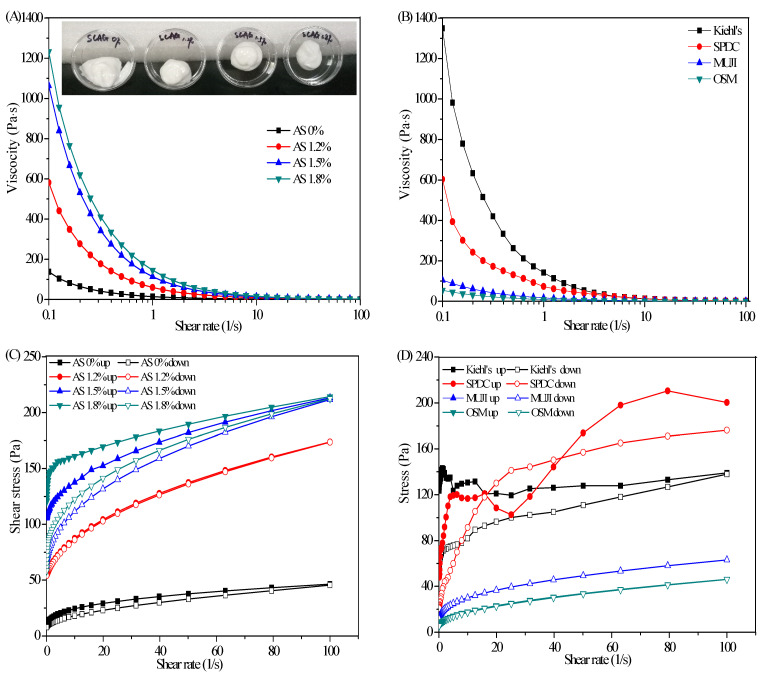
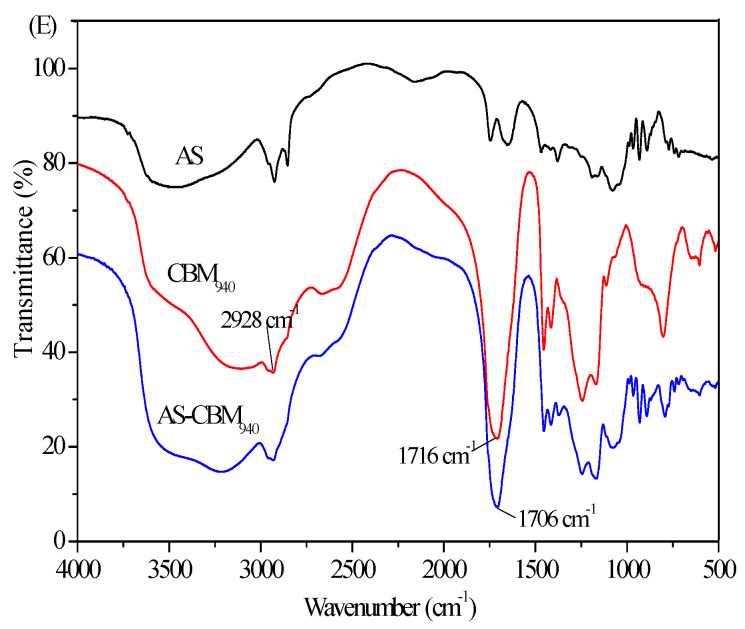
Figure 3.
Viscosity curves and thixotropy curves for cosmetics and SFC and FTIR spectra of AS−CBM940. (A) Viscosity curves of SFC with different AS concentration; (B) viscosity curves of commercial moisturizers (Kiehl’s and SPDC) and lotions (MUJI and OSM); (C) thixotropy curves of emulsion gels with different AS concentration; (D) thixotropy curves of commercial moisturizers and lotions; (E) FTIR spectra of AS, CBM940, and AS−CBM940.


