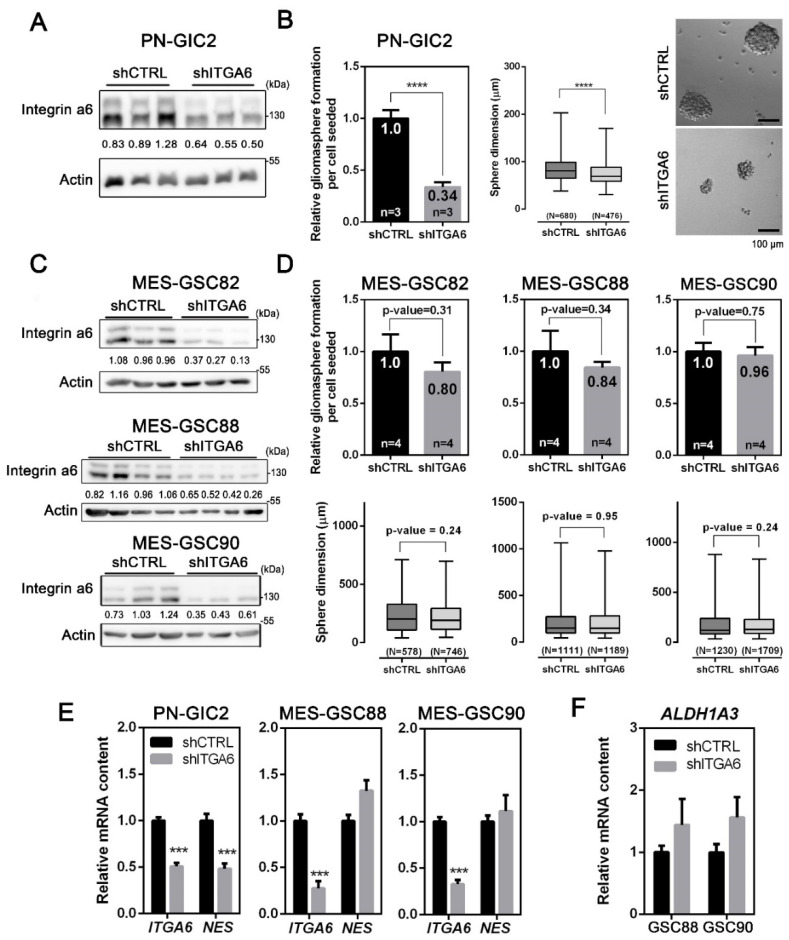
Figure 2.
Silencing of integrin a6 in MES-GSCs does not have an impact on stemness and self-renewal. (A,C) Representative Western blot of the lentiviral-based shRNA silencing of ITGA6 in PN-GIC2 (A) and MES-GSCs (C). The values indicated within blots are relative to the densitometric analysis. Numbers indicate the normalized integrin a6 intensity ratio relative to the mean of normalized shCTRL samples. (B) Assessment of self-renewal capacity (mean ± SEM; n = 3; unpaired t-test) and sphere size (mean ± SEM; n = 3; Mann–Whitney test) in PN-GSCs silenced for ITGA6. Micrographs from representative fields of gliomaspheres (scale bar = 100 µm). (D) Self-renewal capacity (mean ± SEM; n = 4; unpaired t-test) and sphere size (mean ± SEM; n = 4; Mann–Whitney test) in MES-GSCs silenced for ITGA6. The number of independent experiments—n, the number of gliomaspheres scored for each condition—N. The values specified within the bar plot indicate the mean relative self-renewal capacity. (E) Transcript levels of ITGA6 and NES detected by means of qPCR in shITGA6 PN-GSCs and MES-GSCs (mean ± SEM; n = 3; unpaired t-test). (F) Relative transcript amount of ALDH1A3, a specific MES stem cell marker, in shITGA6 MES-GSCs (mean ± SEM; n = 3; unpaired t-test). *** p < 0.001; **** p < 0.0001.

