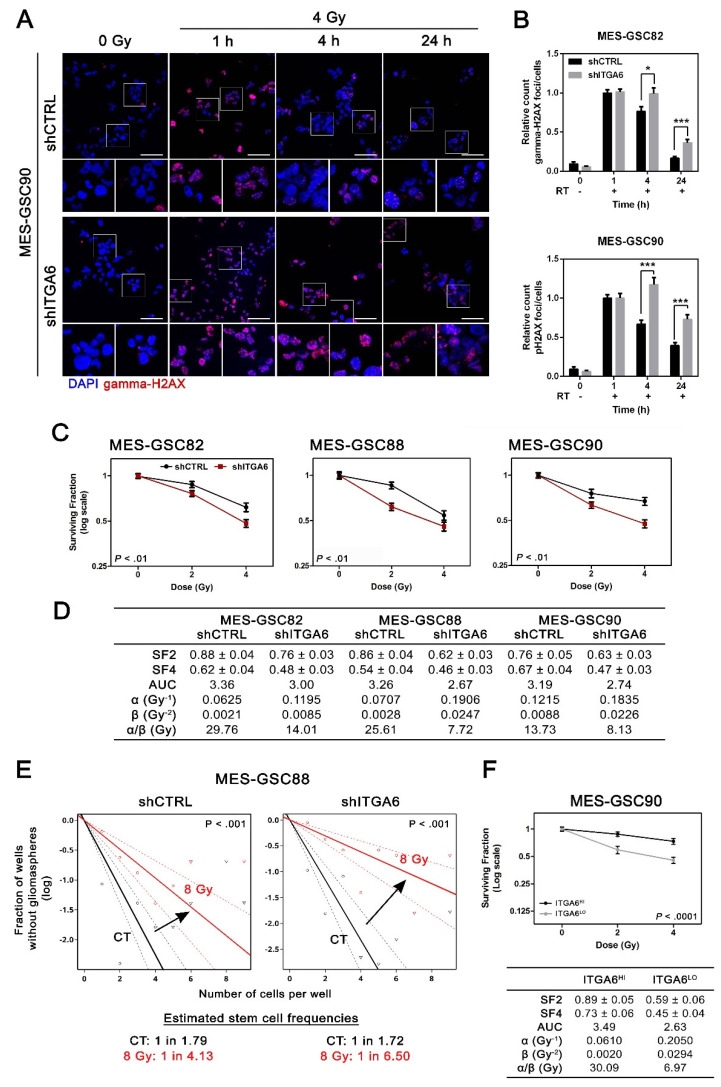
Figure 4.
Inhibition of integrin a6 expression in MES-GSCs triggers radiosensitivity. (A,B) Gamma-H2AX foci decay after IR-induced DNA damage. (A) Representative microsections of the gamma-H2AX foci detected in MES-GSC90 by immunofluorescence (scale bar = 50 µm). Gamma-H2AX foci were stained in red, while nuclei were counterstained with DRAQ5. Smaller frames display the same sections at higher magnification. (B) Absolute quantitation of gamma-H2AX foci after a single fraction of 4 Gy (mean ± SEM; n = 3; unpaired t-test). A minimum of 10 fields per condition reaching a minimum of 70 cells in total were analysed (n = 3). (C) Survival curves of MES-GSCs obtained for control (shCTRL) and ITGA6-inhibited cultures (shITGA6) following RT (n = 4). Two-way ANOVA reported within each plot. (D) Linear quadratic model and survival curve parameters to quantify radiation sensitivity. SF2 and SF4 are indicated as mean ± SEM. SF2, surviving fraction at 2 Gy; SF4, surviving fraction at 4 Gy; AUC, area under the curve. (E) In vitro extreme limiting dilution assay to test radiation sensitivity. It revealed the sphere formation frequencies of control and shITGA6 MES-GSC88 untreated or 8 Gy irradiated. Pairwise test p-value reported within each single plot. (F) (top) Survival curve of MES-GSC90 obtained for ITGA6HI and ITGA6LO cultures following RT (n = 3; two-way ANOVA). (bottom) Linear quadratic model and survival curves parameters to quantify radiation sensitivity. * p < 0.05; *** p < 0.001.

