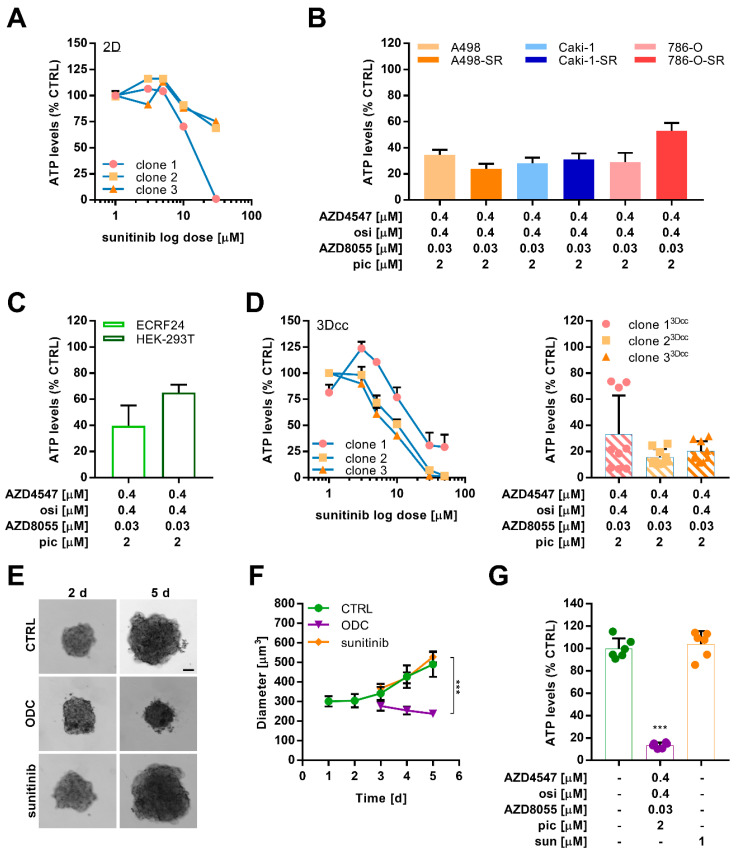
Figure 5.
Tumor growth of Caki-1 and Caki-1-SR in vivo and ex vivo use for testing of optimized drug combinations. (A) Viability, measured as ATP levels, of sunitinib-resistant clones in a 2D monolayer (2D). (B) Response of sunitinib-naïve and -resistant ccRCC cells to an optimized multidrug combination treatment (ODC) containing AZD4547 (0.4 µM), osimertinib (osi, 0.4 µM), AZD8055 (0.03 µM), and pictilisib (pic, 2 µM). (C) Effect of the ODC on non-cancerous cells ECRF24 and HEK-293T. (D) Viability, measured as ATP levels, of sunitinib-resistant clones in heterotypic 3D co-culture (3Dcc) with 10% endothelial cells (ECRF24) and 20% fibroblasts (NHDFα cells) in response to increasing doses to sunitinib (left graph) and the ODC (right graph). Error bars represent the SD. (E) Representative bright-field images of murine ex vivo spheroids taken on days 2 and 5 (2–5 d) after seeding. ODC treatment was applied onto the spheroids on 2 d and maintained for 72 h until 5 d.). Sunitinib was applied at a concentration of 1 µM. Scale bar = 100 µm. (F) Size measurements of the diameter of the murine ex vivo spheroids in time. Spheroids remained untreated (CTRL) or were treated with either the ODC or 1 µM sunitinib. Error bars represent the SD of six spheroids per condition (n = 6). (G) Bar graphs representing the ATP levels (viability) as % compared to the CTRL in response to 72 h treatment with ODC and sunitinib. Error bars represent the SD of six spheroids per condition (n = 6). Statistical significance was calculated based on n = 6 independent experiments by using a one-way ANOVA with unequal variances; *** p < 0.001.

