
Fig. 1.
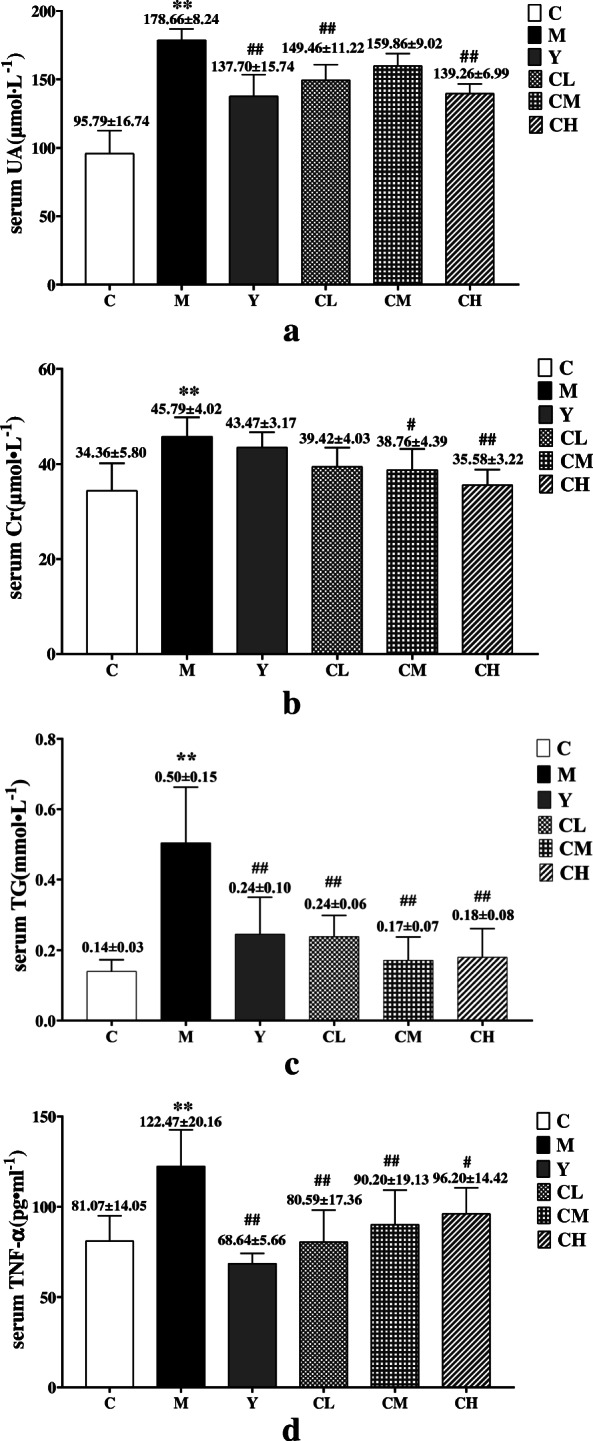
The results of serum biochemistry analysis. a UA level, b Cr level, c TG level, d TNF-α level. C, control group; M, model group; Y, benzbromarone group; CL, low dosage group; CM, medium dosage group; CH, high dosage group; values are given as the mean ± SD (n = 7), ANOVA, Tukey post hoc and nonparametric test were used for statistical analysis, **, P < 0.01 vs. control group. *, P < 0.05 vs. control group; ##, P < 0.01 vs. model group; #, P < 0.05 vs. model group