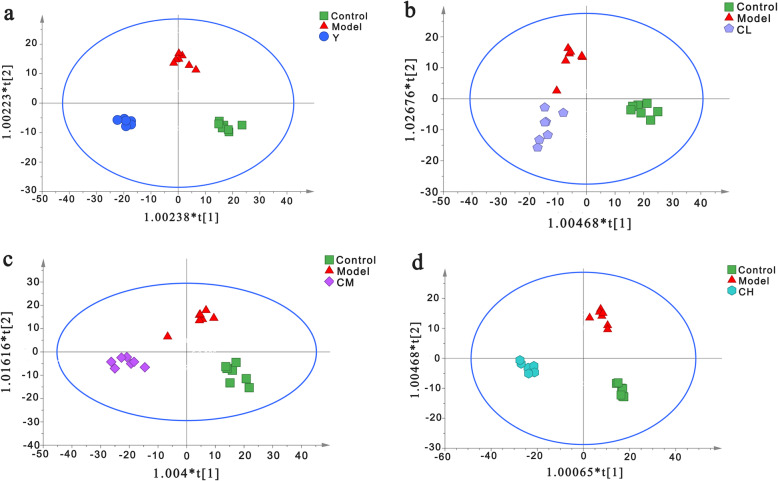
Fig. 4.
Metabolic profiles of rat serum in the control, model, benzbromarone, and different dose Plantaginis semen groups. a Metabolic profiles of rat serum in C, M and Y group, b Metabolic profiles of rat serum in C, M and CL group, c Metabolic profiles of rat serum in C, M and CM group, d Metabolic profiles of rat serum in C, M and CH group. C, control group; M, model group; Y, benzbromarone group; CL, low dosage group; CM, medium dosage group; CH, high dosage group

