Figure 1.
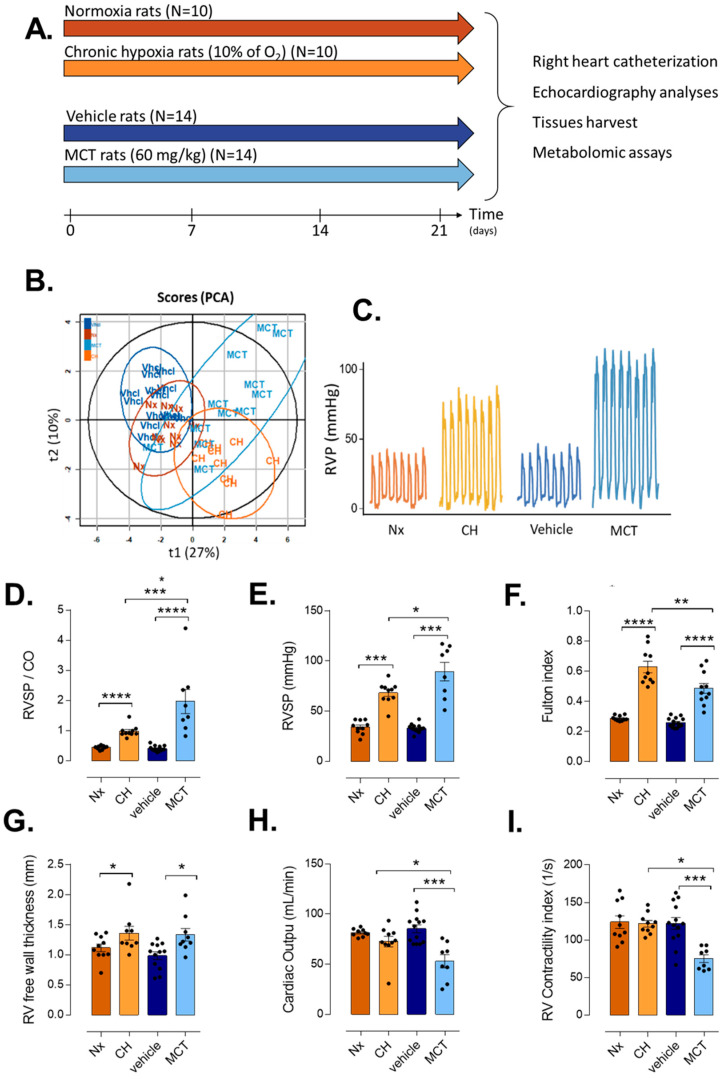
Characterization of pulmonary hypertension by echocardiography and right heart catheterization of CH-PH and MCT-PH rats and their respective controls. (A). Experimental protocol. Preparation and analysis of CH-PH rats, MCT-PH rats, Normoxia rats (as control for CH-PH rats), and Vehicle rats (as controls for MCT-PH). (B). Principal Component Analysis (PCA) projection from all echocardiography and catheterization parameters. (C). Representation of the record of right ventricular pressure (RVP) expressed in mmHg. (D–I). Bar graph of top-six altered parameters in normoxia (Nx), chronic hypoxia (CH), vehicle and monocrotaline (MCT) rats: (D). Right ventricular systolic pressure (RVS.P). (E). Pulmonary vascular resistance (PVR, evaluated by RVS.P/Cardiac output ratio). (F). RV hypertrophy by measuring the Fulton index. (G). RV free wall thickness index. (H). Cardiac output. (I). RV contractility index. t-tests were used after verification of normal distribution of values (Shapiro–Wilk normality test). p-values are shown in Supplementary Table S1. Significance: * p ≤ 0.05; ** p ≤ 0.01; *** p ≤ 0.001, **** p ≤ 0.0001.

