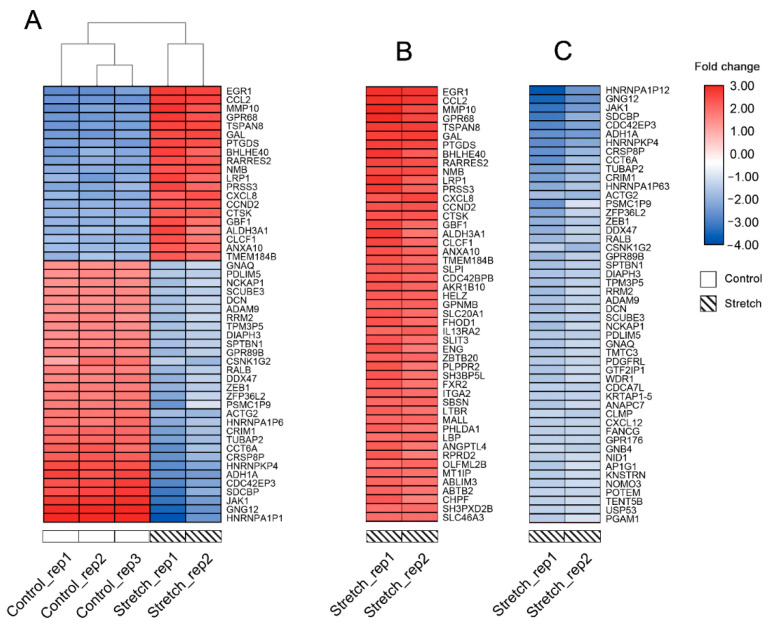
Figure 3.
(A) Cluster heatmap demonstrates top 50 DEGs with the greatest absolute fold change, and hierarchical clustering analysis results according to groups. Each row represents a DEG, and each column represents a sample; (B) top 50 upregulated DEGs of distraction group; (C) top 50 downregulated DEGs of distraction group. The colour displays the fold change. Red indicates upregulation in gene expression, and blue indicates downregulation. The darker in colour, the greater fold change.

