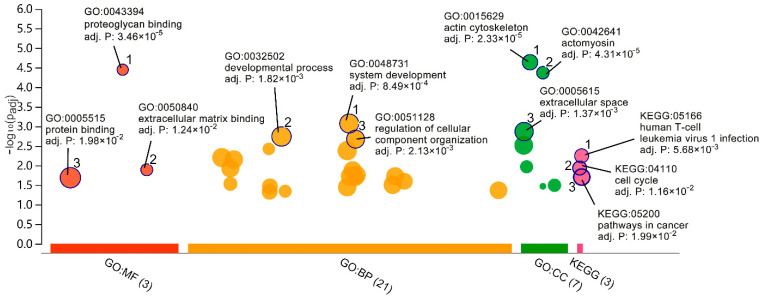
Figure 4.
GO enrichment and KEGG pathway enrichment analysis. In the vertical direction, the higher the bubbles, the more significantly enriched. In the horizontal direction, terms from the same GO subtree are located closer to each other. Bubbles’ size stands for term size (gene quantity contained). The X-axis represents the group of functional terms and coloured by data sources, and the Y-axis lays out the adjusted p-value on the negative log10 scale.

