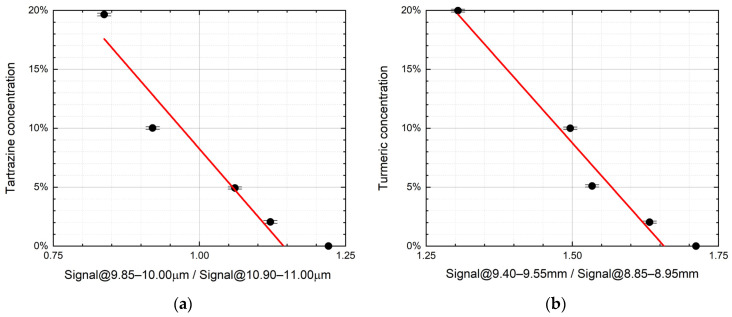
Figure 4.
(a) Tartrazine mass ratio vs. the normalized LPAS signal in the 9.85–10.00 μm range, i.e., the ratio of the average LPAS signals in the 9.85–10.00 μm and 10.90–11.00 μm ranges (r2 = 0.93). (b) Turmeric mass ratio vs. the normalized average LPAS signals in the 9.40–9.55 μm range, i.e., the ratio of the average LPAS signals in the 9.40–9.55 μm and 8.85–8.95 μm ranges (r2 = 0.97). The error bars depend on the weighing accuracy.

