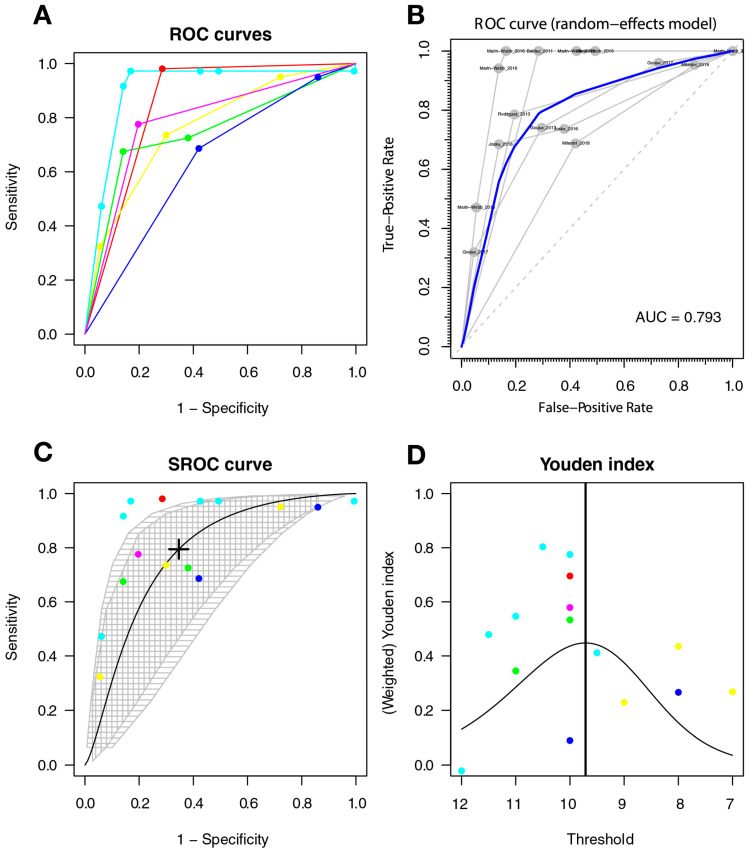
Figure 6.
The IHDS for screening HAD. Individual studies are displayed as colored lines. Each point represents a reported threshold value, points of the same color represent thresholds reported within the same study. The cross in the SROC curve indicates the Youden-based threshold value: sensitivity = 0.794 (95%CI 0.468–0.944], specificity = 0.654 (95%CI 0.335–0.876), and AUC = 0.777 (with a CI: [ 0.597–0.893] [0.554–0.91]). (A). Descriptive ROC curve. (B). ROC—random-effects model. The points are the pairs of the true-positive and false-positive rates used in the meta-analysis. (C). SROC curve with estimation and confidence interval. as grey area. (D). The estimation of the Youden index.

