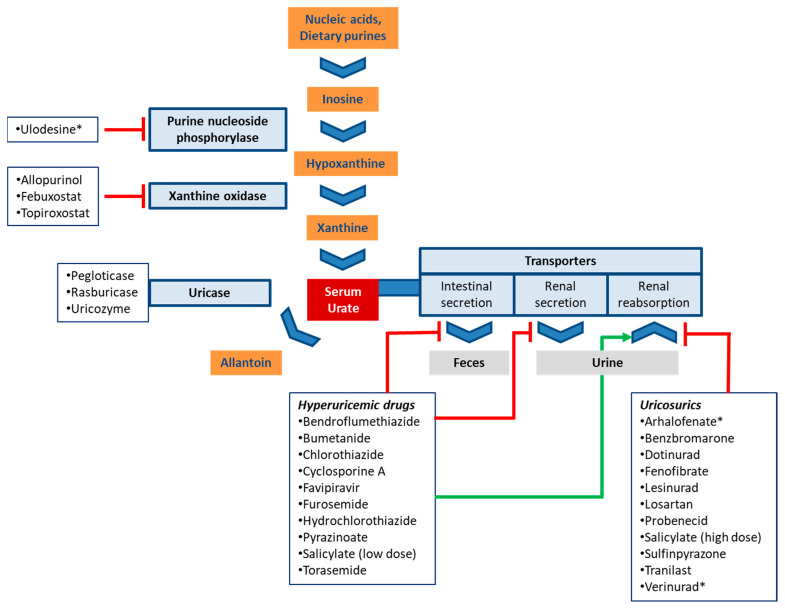
Figure 1.
Schematic routes of urate production and disposition. The boxes list drugs that affect urate homeostasis and are discussed in this review. Experimental drugs are marked with an asterisk (*). Red bars (inhibition) and the green arrow (stimulation) indicate the main mechanism by which drugs modulate serum urate levels.

