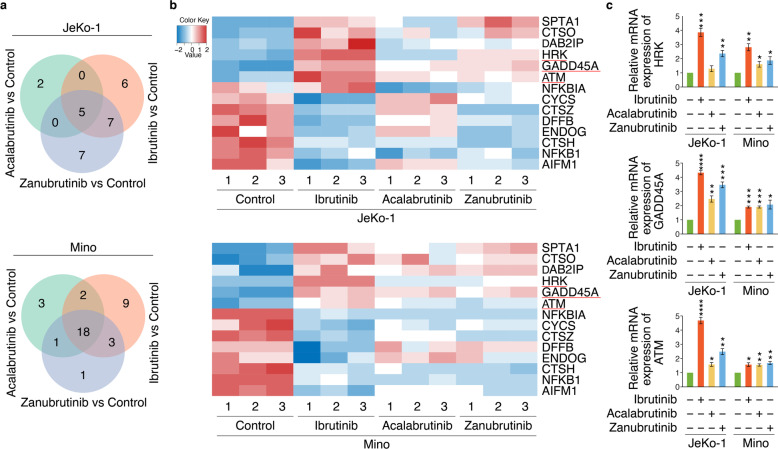
Fig. 2.
RNA-seq identified apoptosis-related targets of BTKi. a Venn diagram illustrating the number of genes involved in apoptosis which were commonly and differentially regulated by the treatment of Ibrutinib, Acalabrutinib or Zanubrutinib compared to control treatment in JeKo-1 and Mino cells. b Heatmap of apoptosis related DEGs regulated by Ibrutinib, Acalabrutinib or Zanubrutinib in both JeKo-1 and Mino cells, versus control respectively. Red represents upregulation and blue indicates downregulation. c Analysis of mRNA expression of HRK, GADD45A and ATM in JeKo-1 and Mino cells (n = 3) via qRT-PCR, which were treated with Ibrutinib, Acalabrutinib or Zanubrutinib (2 μM). Data are shown as mean ± SEM; *P < 0.05; **P < 0.01; ***P < 0.001; ****P < 0.0001, as calculated using one-way ANOVA with Tukey’s multiple comparisons test

