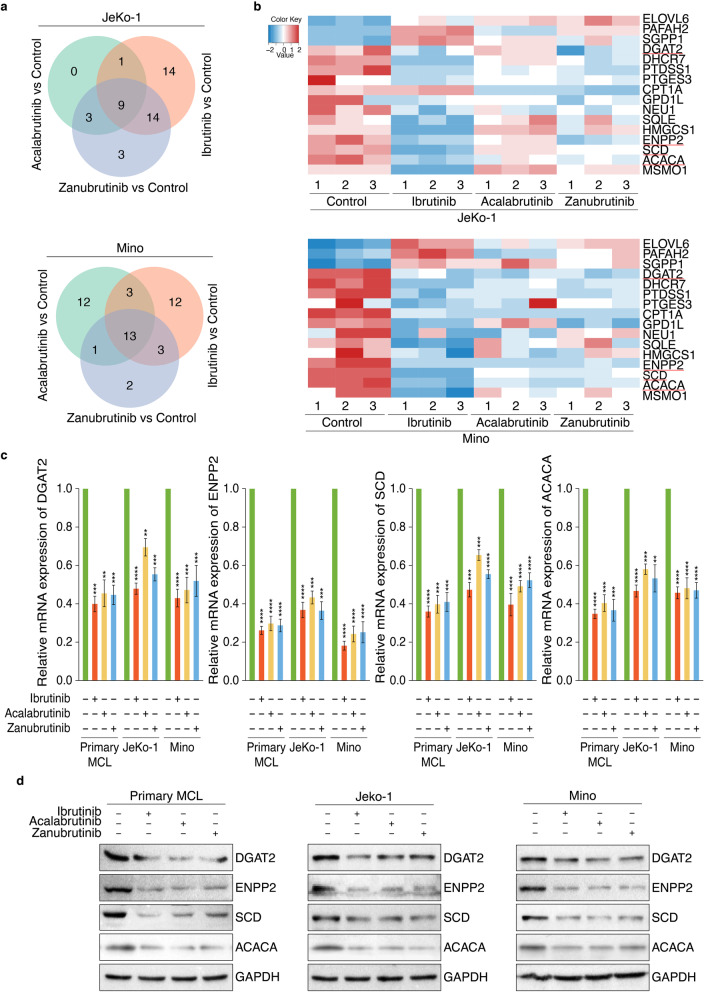
Fig. 5.
RNA-seq identified LD accumulation related targets of BTKi. a Venn diagram showing the relationship between DEGs of three drug treatment groups, which were involved in lipid metabolism. DEGs were analyzed by comparing Ibrutinib, Acalabrutinib or Zanubrutinib treatment group with untreatment control group. b Heatmap of cell growth and death related DEGs regulated by Ibrutinib, Acalabrutinib or Zanubrutinib in both JeKo-1 and Mino cells, versus control respectively. Red represents upregulation and blue indicates downregulation. c Analysis of mRNA expression of DGAT2, ENPP2, SCD and ACACA in MCL cells via qRT-PCR (n = 3), which were treated with Ibrutinib, Acalabrutinib or Zanubrutinib (2 μM), and primary MCL cells collected from patient 1–3. Data are shown as mean ± SEM; **P < 0.01; ***P < 0.001; ****P < 0.0001, as calculated using the Student’s t-test. d Analysis of protein expression of DGAT2, ENPP2, SCD and ACACA in MCL cells via immunoblot analysis, which were treated with Ibrutinib, Acalabrutinib or Zanubrutinib (2 μM), and primary MCL cells collected from patient 1

