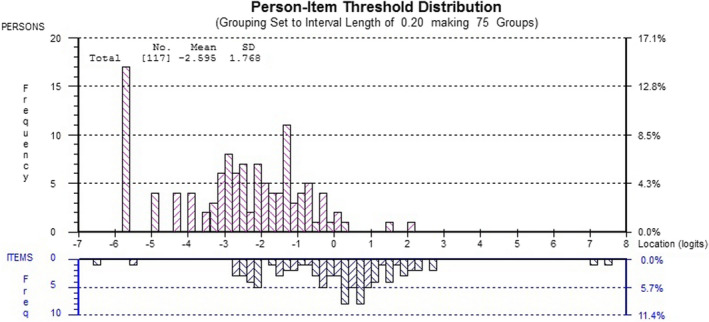
FIGURE 1.

Person‐item‐fit threshold distribution. The participants’ fit distribution is shown in the upper histogram, and the items’ fit distribution in the lower histogram. The x‐axis represents the degree of meaningful patient engagement, with a higher number indicating a lower degree of engagement
