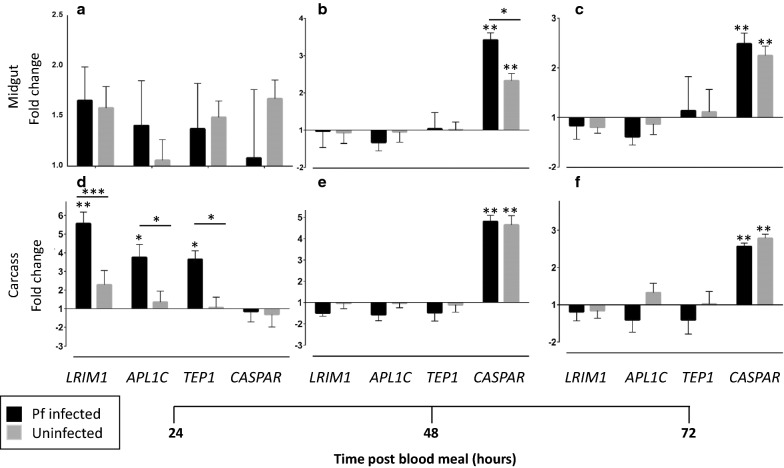
Fig. 2.
Relative transcript levels of immune genes in adult female Anopheles stephensi. LRIM1, APL1C, TEP1 and Caspar in the midgut (a–c) and carcass (d–f) of female Anopheles stephensi 24 h (a, d), 48 h (b, e) and 72 h (c, f) after feeding on blood with (black bars) or without (gray bars) Plasmodium falciparum gametocytes. Bars represent mean of triplicate experiments ± standard error of mean. *p < 0.05; **p < 0.02; ***p < 0.01. Asterisks above each bar show comparison to baseline; asterisks above horizontal lines show comparison between treatments. Transcript levels are reported as a fold expression compared to naïve non-blood fed females

