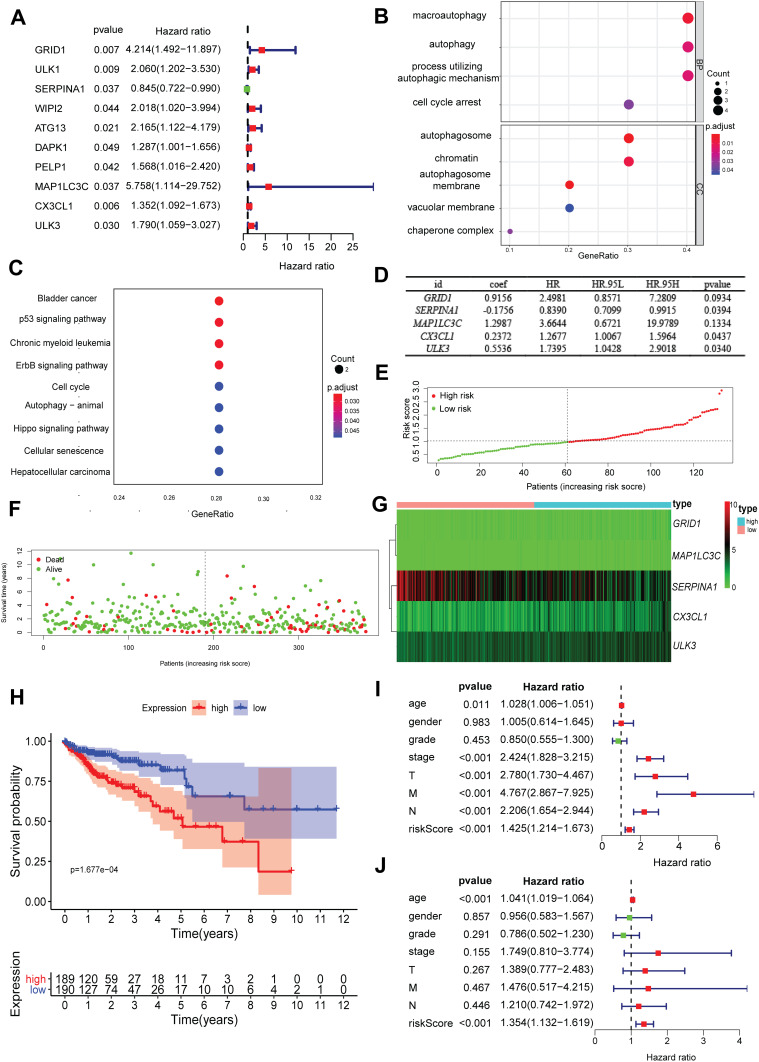
Figure 1.
Development of a prognostic index based on ARGs and expression profile and prognostic value of ARGs. (A) Risk ratio forest plot showed the prognostic value of the gene; (B) GO analysis revealed the biological processes and cellular components involved in 10 prognostic-related ARGs; (C) KEGG shows the signaling pathways involved in 10 prognostic-related ARGs; (D) The result of multivariate Cox regression analysis: 5 ARGs were significantly related to prognosis independently; (E) Distribution of prognostic index; (F) Survival status of patients in different groups; (G) Heat map of the expression profile of the included ARGs; (H) Patients in the high-risk group have a shorter OS. A forest plot of univariate (I) and multivariate (J) Cox regression analysis in COAD.

