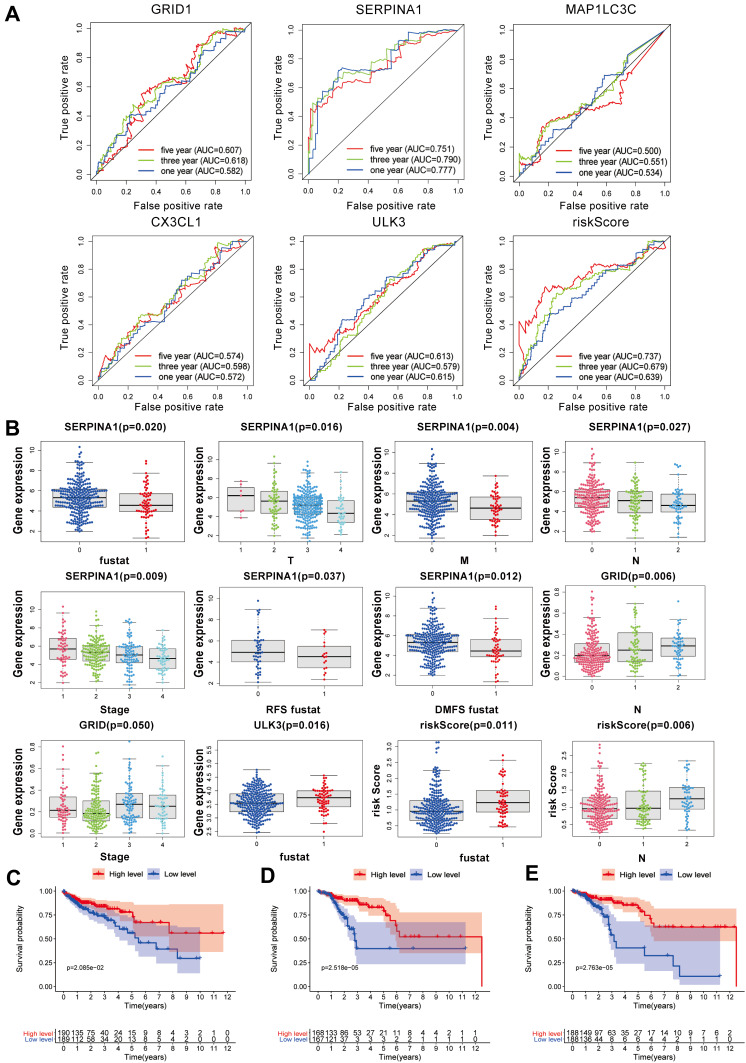
Figure 2.
ROC curve analysis for ARGs and clinical prognostic diagnostic value of ARGs in COAD and the relationship between SERPINA1 and OS, RFS, and DMFS. (A) ROC curve analysis to determine the potential diagnostic value of the risk ARGs in COAD. The ROC curve plots for 5-years survival rate: GRID1 (AUC = 0.507), SERPINA1 (AUC = 0.751), MAPILC3C (AUC = 0.500), CX3CL1 (AUC = 0.574), ULK3 (AUC = 0.613), risk Score (AUC = 0.737). (B) Clinicopathological significance of the prognostic index of COAD (p<0.05). (C) Kaplan–Meier curve estimated the relationship between SERPINA1 and overall survival (OS). (D) Kaplan–Meier curve estimated the relationship between SERPINA1 and RFS. (E) Kaplan–Meier curve estimated the relationship between SERPINA1 and distant metastasis-free survival DMFS. The Log rank test was performed to test the statistical significance.

