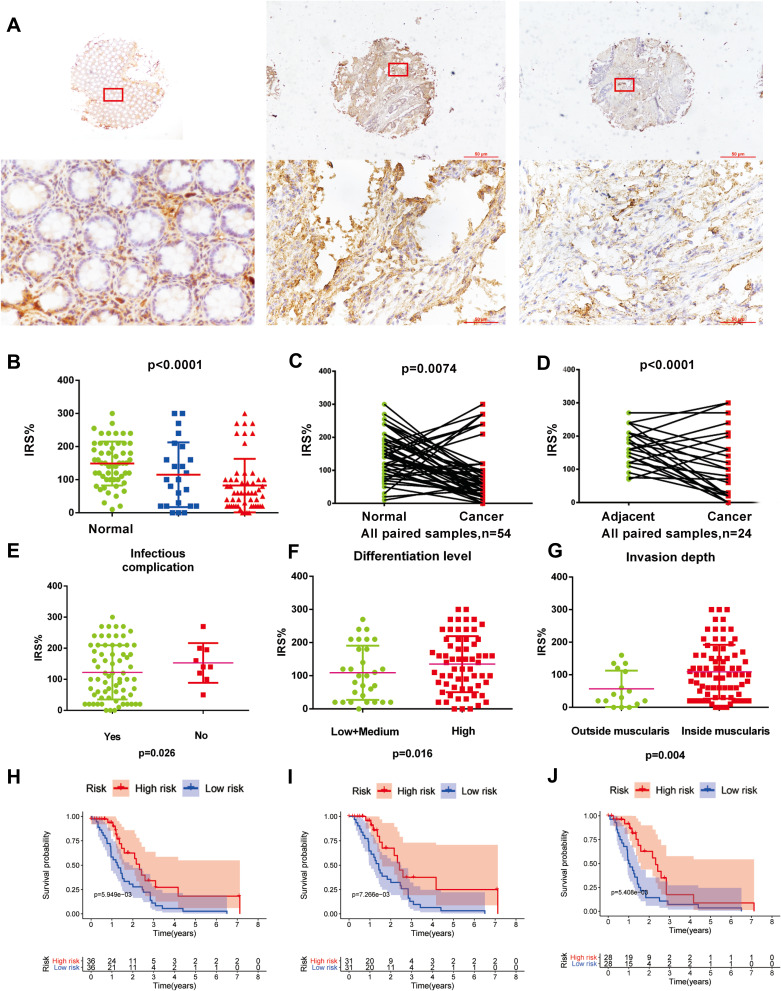
Figure 3.
SERPINA1 expression in colon cancer and K-M curve with OS, RFS, DMFS for IHC. (A) Representative micrographs showing immunohistochemical staining of SERPINA1 in normal tissue, tumor-adjacent tissue, and colorectal cancer tissue. Magnification: ×40. Arrows indicate magnified regions in the insert (×400). Scale bar: 50 μm. (B) IRS of normal tissues and adjacent tissues SERPINA1 expression was significantly higher than cancer tissues. (C) IRS of paired cancer samples SERPINA1 expression was significantly lower than normal tissues. (D) IRS of paired samples SERPINA1 expression was significantly lower than tumor-adjacent tissues. the p-value of (B-D) obtained from the Wilcoxon rank-sum test. (E) IRS of SERPINA1 expression with infectious complication. (F) IRS of SERPINA1 expression of differentiation level. (G) IRS of SERPINA1 expression of invasion depth. (H) Kaplan–Meier curve estimates the relationship between SERPINA1 and OS. (I) Kaplan–Meier curve estimates the relationship between SERPINA1 and RFS. (J) Kaplan–Meier curve estimates the relationship between SERPINA1 and DMFS. The Log rank test was performed to test the statistical significance.

