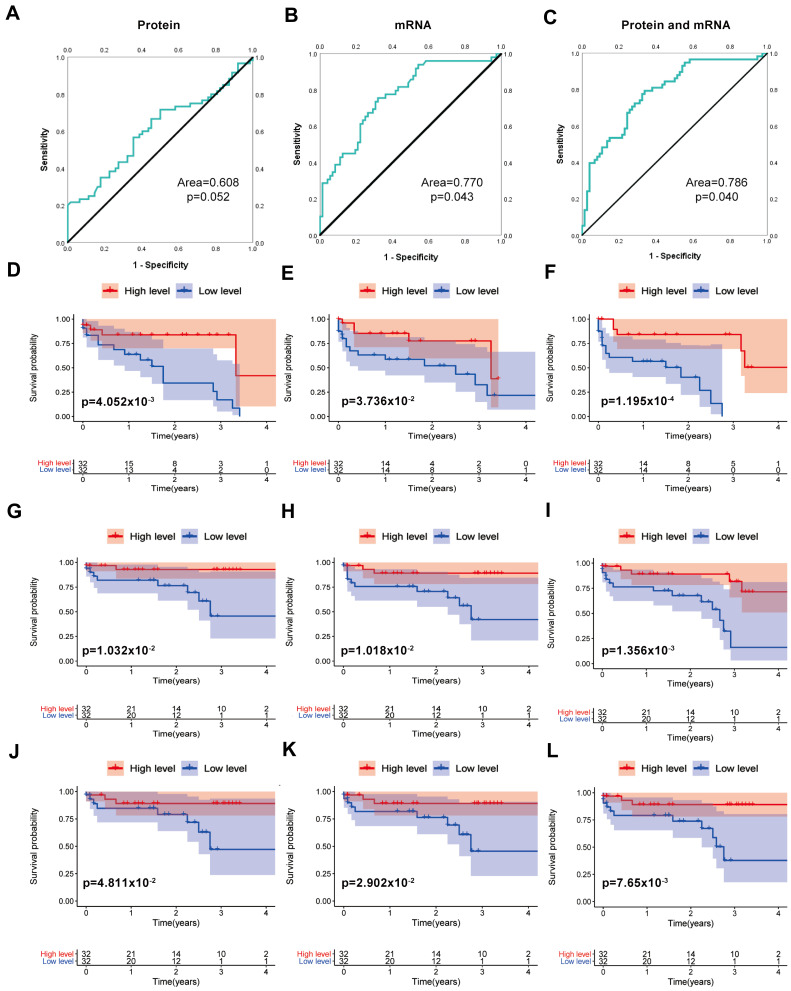
Figure 4.
The ROC and K-M curve analysis of the influence of SERPINA1 on COAD. (A) SERPINA1 protein, Area=0.773, p=0.004. (B) SERPINA1 mRNA, Area=0.770, p=0.043. (C) SERPINA1 mRNA and protein combine. Area=0.786, p=0.04. (D) Kaplan–Meier curve estimates the relationship between SERPINA1 mRNA and overall survival. (E) Kaplan–Meier curve estimates the relationship between SERPINA1 protein and overall survival. (F) Kaplan–Meier curve estimates the relationship between CI and overall survival. (G) Kaplan–Meier curve estimates the relationship between SERPINA1 mRNA and RFS. (H) Kaplan–Meier curve estimates the relationship between SERPINA1 protein and RFS. (I) Kaplan–Meier curve estimates the relationship between CI with RFS. (J) Kaplan–Meier curve estimates the relationship of SERPINA1 mRNA with DMFS. (K) Kaplan–Meier curve estimates the relationship of SERPINA1 protein with DMFS. (L) Kaplan–Meier curve estimates the relationship between CI with DMFS.

