Figure 1.

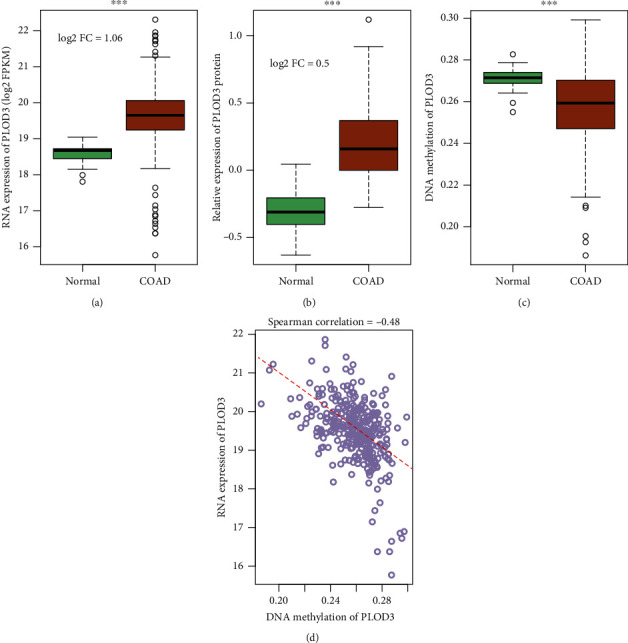
PLOD3 is upregulated in COAD. The RNA and protein expression of PLOD3 are upregulated in the COAD samples of (a) TCGA and (b) CPTAC cohorts, respectively. (TCGA(tumor) = 469, TCGA(normal) = 41, CPTAC(tumor) = 97, and CPTAC(normal) = 100). (c) The PLOD3 promoter is hypomethylated in COAD samples of TCGA cohort. (d) The promoter DNA methylation and RNA expression of PLOD3 are negatively correlated in TCGA cohort. The line was fitted by using RNA expression and DNA methylation of PLOD3 as response and predictor variables, respectively. The symbol ∗∗∗ indicates the P value <0.001 (log2 FC: log2 fold change).
