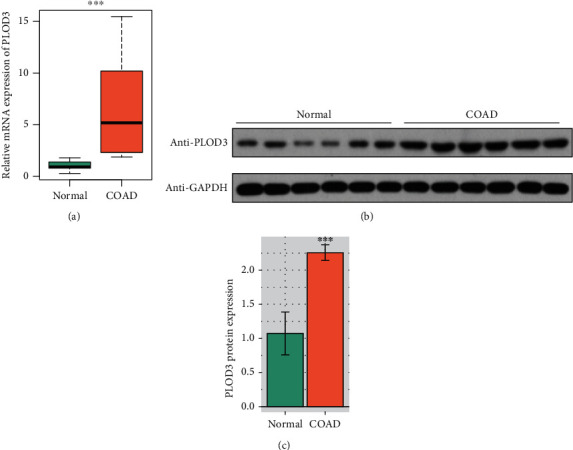
Figure 2.

Validation of PLOD3 upregulation in COAD and adjacent normal tissue samples. (a) The mRNA expression of PLOD3 is upregulated in the COAD tissue of our cohort using the qPCR method (n = 6). (b, c) The protein expression of PLOD3 is upregulated in COAD samples of our cohort using Western blot. The symbol ∗∗∗ indicates the P value <0.001.
