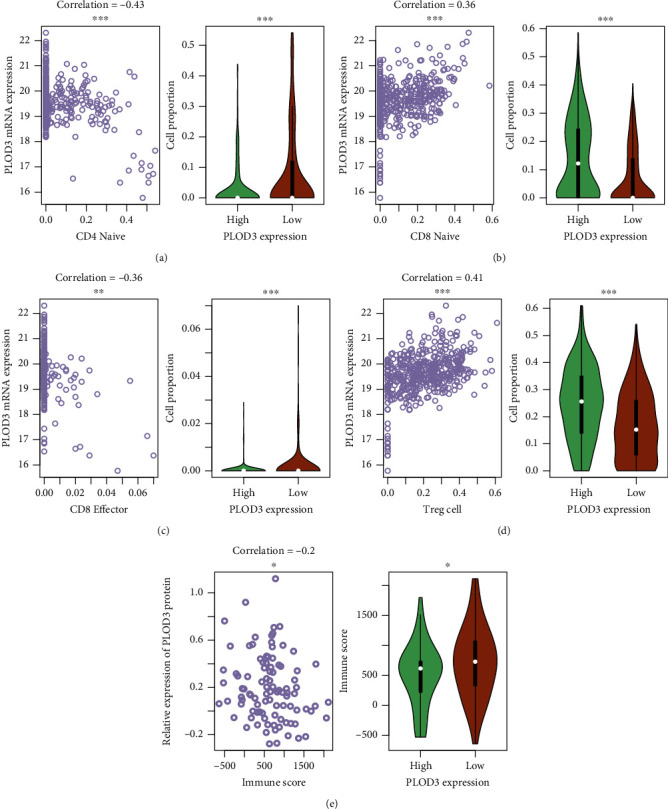
Figure 5.

Correlation between immune cell infiltration and PLOD3 expression. The correlation between PLOD3 expression and the proportions of tumor-infiltrating immune cells, including CD4 naïve, CD8 naïve, CD8 effector, and Tregs, and immune scores are displayed in (a–d) and (e), respectively. The symbols of ∗, ∗∗, and ∗∗∗ indicate the P values <0.05, 0.01, and 0.001, respectively.
