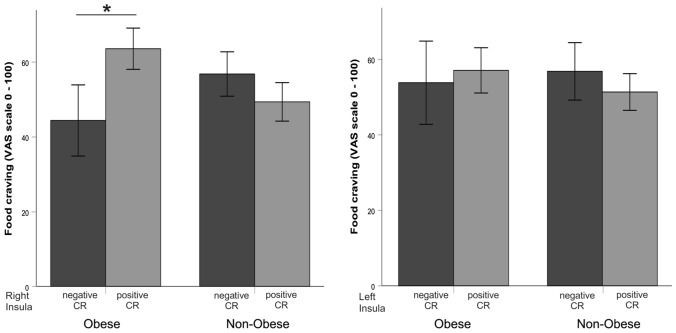
Fig. 2.
Illustration of the higher food craving [visual analogue scale (VAS)] in patients suffering from obesity with positive cue-reactivity (CR) [mean activation (contrast: food – neutral) > 0] in the right insula (mean = 66.4, SE = 6.9), compared to those with negative cue-reactivity (CR) [mean activation (contrast: food – neutral) ≤ 0] in this area (mean = 42.3, SE = 7.9, F(1,19) = 5.204, p = 0.048*). Non-obese individuals with positive (mean = 56.0, SE = 8.7) and negative cue-reactivity (CR) (mean = 55.0, SE = 6.3) reported similar food-craving (F(1,20) = 0.132, p = 0.724)

