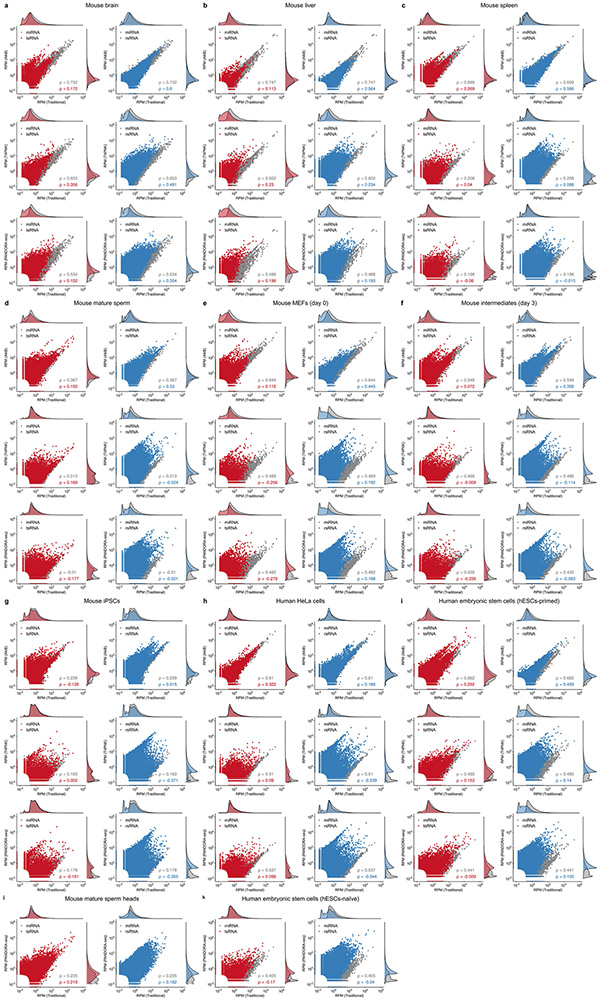
Extended Data Fig. 4 ∣. Scattered plot comparison of profile changes in tsRNAs and rsRNAs compared to miRNAs under different treatment protocol.
Scattered plot comparison of profile changes in tsRNAs (red dots) and rsRNAs (blue dots) compared to miRNAs (gray dots) under AlkB vs traditional, T4PNK vs traditional and PANDORA-seq vs traditional in (a) mouse brain, (b) mouse liver, (c) mouse spleen, (d) mouse mature sperm, (e) mouse MEFs (day 0), (f) mouse intermediate cells (day 3), (g) mouse iPSCs, (h) human HeLa cells, (i) human hESCs-primed, (j) mouse mature sperm heads, and (k) human hESCs-naïve.

