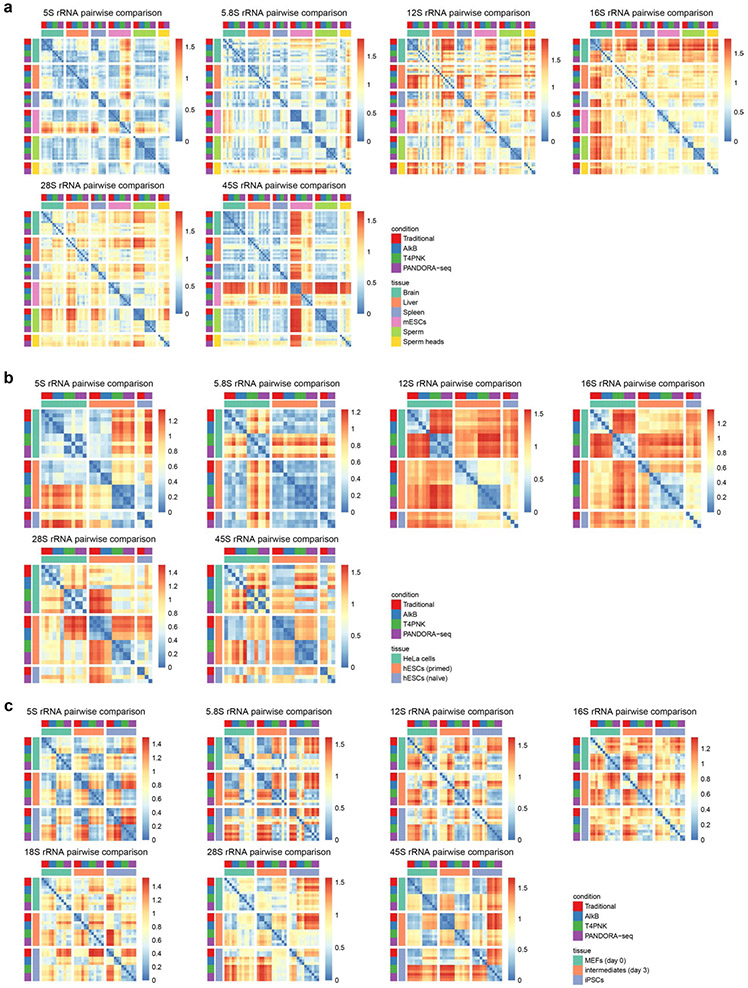
Extended Data Fig. 8 ∣. The pairwise comparison matrices showing the differential expression pattern of rsRNAs under different RNA-seq protocol across tissues and cells.
a, Pairwise comparison matrices for six mouse tissue/cell types, including 5S rRNA, 5.8S rRNA, mitochondrial 12S rRNA, mitochondrial 16S rRNA, 28S rRNA and 45S rRNA. Color bar: from blue (more similar) to red (more different). b, Pairwise comparison matrices for three human cell types, including 5S rRNA, 5.8S rRNA, mitochondrial 12S rRNA, mitochondrial 16S rRNA, 28S rRNA and 45S rRNA. Color bar: from blue (more similar) to red (more different). c, Pairwise comparison matrices for during mouse iPSC reprogramming, including 5S rRNA, 5.8S rRNA, mitochondrial 12S rRNA, mitochondrial 16S rRNA, 18S rRNA, 28S rRNA and 45S rRNA. Color bar: from blue (more similar) to red (more different).

