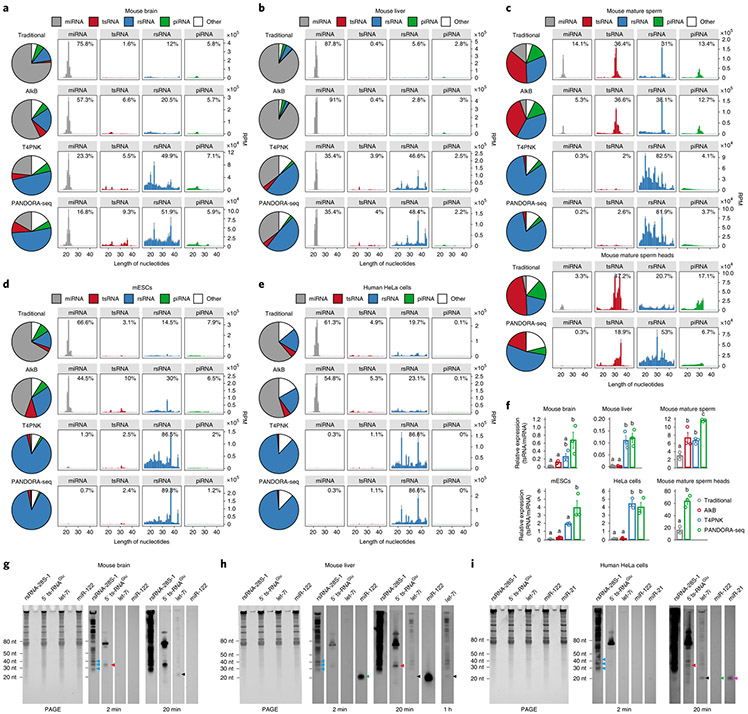
Fig. 2 ∣. Read summaries and length distributions of different sncRNA categories under traditional RNA-seq, AlkB-facilitated RNA-seq, T4PNK-facilitated RNA-seq and PANDORA-seq.
a–e, Comparison of different protocols in five representative tissue or cell types (from a total of 11; the results for the other tissue and cell types are provided in Supplementary Fig. 1): mouse brain (a), mouse liver (b), mouse mature sperm and mature sperm heads (c), mESCs (d) and HeLa cells (e). The results show a dynamic landscape of sncRNAs detected by different methods and across different tissue and cell types. The data represent means ± s.e.m. f, Relative tsRNA/miRNA ratios under different protocols (n = 3 biologically independent samples per bar). Different letters above the bars indicate a statistically significant difference (P < 0.05). Same letters indicate P ≥ 0.05. Statistical significance was determined by two-sided one-way ANOVA with uncorrected Fisher’s LSD test. All data are plotted as means ± s.e.m. g–i, The relative expression levels of miRNAs, tsRNAs and rsRNAs, as revealed by PANDORA-seq, were validated by northern blots. The results for mouse brain (g), mouse liver (h) and HeLa cells (i) are shown. For g–i, similar results were obtained in three independent experiments. Blue arrowheads point to rsRNA-28S-1, red arrowheads point to 5′ tsRNAGlu, black arrowheads point to let-7i, green arrowheads point to miR-122 and purple arrowheads point to miR-21. Statistical source data, precise P values and unprocessed blots are provided in the source data.

