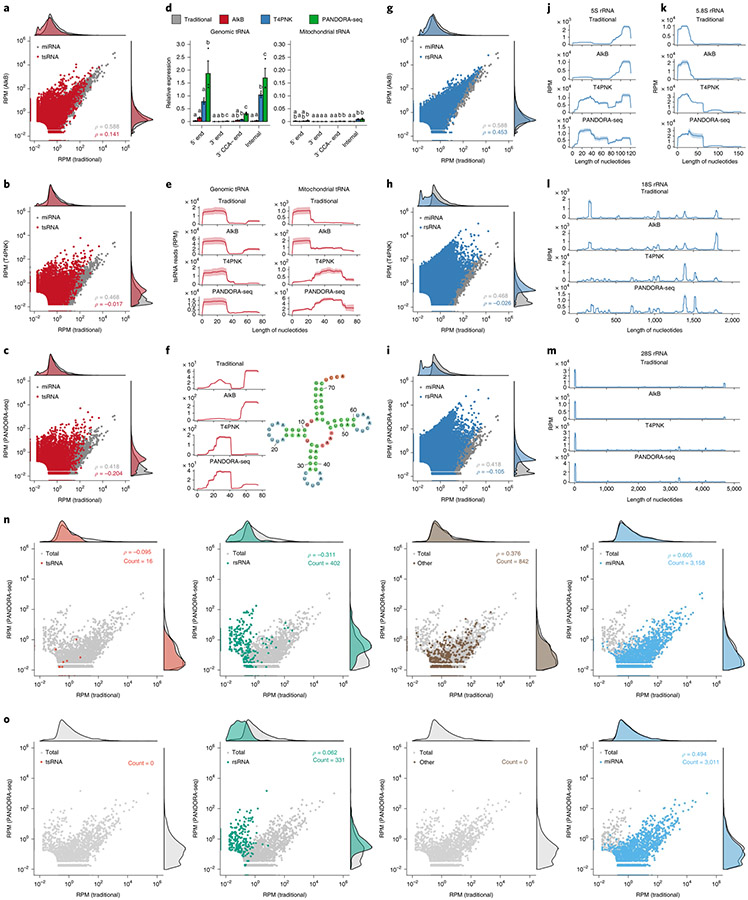
Fig. 3 ∣. Dissecting the effects of AlkB, T4PNK and PANDORA-seq on different sncRNA populations in ESCs.
a–c, Scatter plots comparing profile changes in tsRNAs (red dots) and miRNAs (grey dots) detected using AlkB versus traditional (a), T4PNK versus traditional (b) and PANDORA-seq versus traditional protocols (c). ρ is the Spearman’s correlation coefficient. d, tsRNA responses to AlkB, T4PNK and PANDORA-seq in regard to different origins (5′ tsRNA, 3′ tsRNA, 3′ tsRNA-CCA end and internal tsRNAs). The y axes represent the relative expression level compared with total reads of miRNA (n = 3 biologically independent samples per bar). Different letters above the bars indicate statistically significant differences (P < 0.05). Same letters indicate P ≥ 0.05. Statistical significance was determined by two-sided one-way ANOVA with uncorrected Fisher’s LSD test. All data are plotted as means ± s.e.m. e, Overall length mapping showing the distribution of relative tsRNA reads from mature genomic (left) and mitochondrial (right) tRNA under different RNA-seq protocols. f, Dynamic response to different RNA-seq protocols (left) of a representative individual tsRNA (mouse tRNA-Gln-TTG-2; pictured right). g–i, Scatter plots comparing profile changes in rsRNAs (blue dots) and miRNAs (grey dots) detected using the following protocols: AlkB versus traditional (g), T4PNK versus traditional (h) and PANDORA-seq versus traditional (i). j–m, Comparison of rsRNA-generating loci by rsRNA mapping data on 5S rRNA (j), 5.8S rRNA (k), 18S rRNA (l) and 28S rRNA (m), detected using different RNA-seq protocols. n,o, Many of the previously annotated miRNAs from miRBase that showed upregulation under PANDORA-seq could also be annotated to other sncRNA categories, as exemplified in mESCs (n) and primed hESCs (o). The mapping plots in e, f and j–m are presented as means ± s.e.m. Statistical source data and precise P values are provided in the source data.

