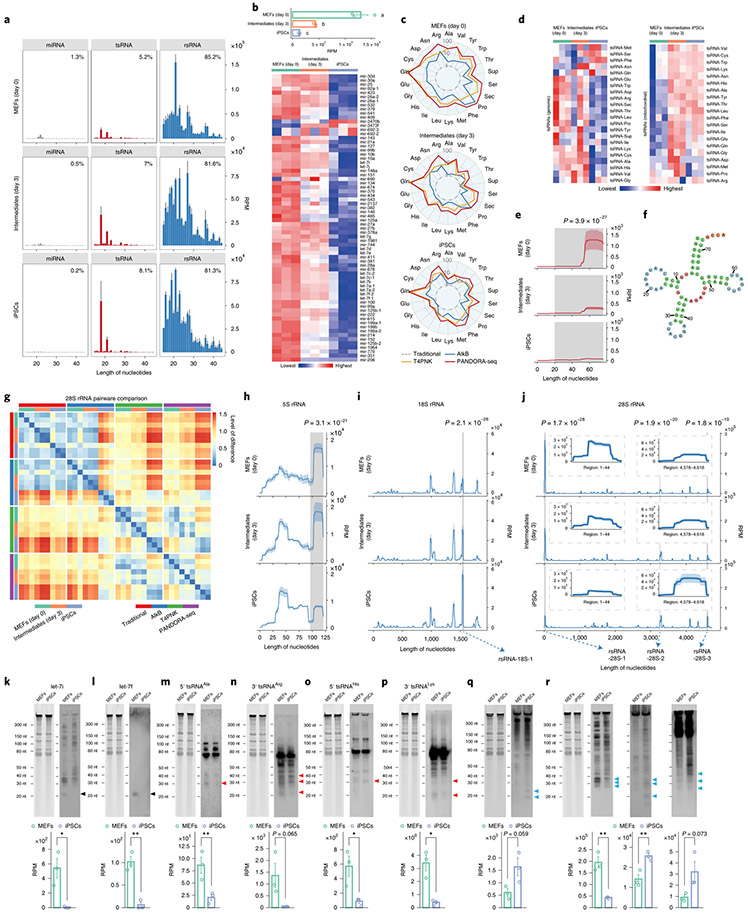
Fig. 5 ∣. PANDORA-seq reveals that tsRNAs and rsRNAs are dynamically regulated during MEF reprogramming to iPSCs (day 0) to intermediate (day 3) and iPSC stages.
a, Dynamic changes in sncRNA distribution during iPSC reprogramming from MEFs (day 0) to intermediate (day 3) and iPSC stages (means ± s.e.m.), as determined by PANDORA-seq. b, Bar plot (top) and heatmap (bottom) showing miRNA expression changes (based on RPM values) during cell reprogramming using PANDORA-seq. c, Radar plots showing the different sensitivities of MEFs, intermediate stages and iPSCs in regard to different RNA-seq protocols. d, Heatmaps showing tsRNA (genomic and mitochondrial) expression levels (based on RPM values) during cell reprogramming using PANDORA-seq. e,f, Dynamic changes (e) of a representative tsRNA (tRNA-Arg-ACG-1; pictured in f) during the reprogramming process, as determined by PANDORA-seq. g, Pairwise comparison matrix showing the correlation of rsRNAs (derived from 28S rRNA) under different RNA-seq protocols during cell reprogramming. Blue signifies more similarity and red more difference. Note that PANDORA-seq revealed a more dynamic change across different stages than traditional RNA-seq. h–j, Comparison of rsRNA-generating loci by rsRNA mapping data on 5S rRNA (h), 18S rRNA (i) and 28S rRNA (j) under PANDORA-seq, showing dynamic changes during the reprogramming process. In e and h–j, the shaded peaks are marked with the significance value for the comparison between MEFs and iPSCs, as determined by two-way ANOVA. The mapping plots in e and h–j are presented as means ± s.e.m. The highlighted windows in i and j show the detailed read mappings of rsRNA-18S-1 (i) and rsRNA-28S-1, -2 and -3 (j), which were used for northern blot validation in q and r (see arrows). k–r, Northern blot examination of representative sncRNAs (let-7i (k), let-7f (l), 5′ tsRNAAla (m), 3′ tsRNAArg (n), 5′ tsRNAHis (o), 3′ tsRNALys (p), rsRNA-18S-1 (q) and rsRNA-28S-1, -2 and -3 (r)) was performed in MEFs and iPSCs. The northern blot signals (similar results were obtained in three independent experiments) showed overall consistency with their corresponding sequencing reads in MEFs and iPSCs, as revealed by PANDORA-seq (n = 3 biologically independent samples per bar). Black arrowheads, miRNAs; red arrowheads, tsRNAs; blue arrowheads, rsRNAs. The data represent means ± s.e.m. Statistical significance was determined by two-sided Student’s t-test (*P < 0.05; **P < 0.01). Statistical source data, precise P values and unprocessed blots are provided in the source data.

