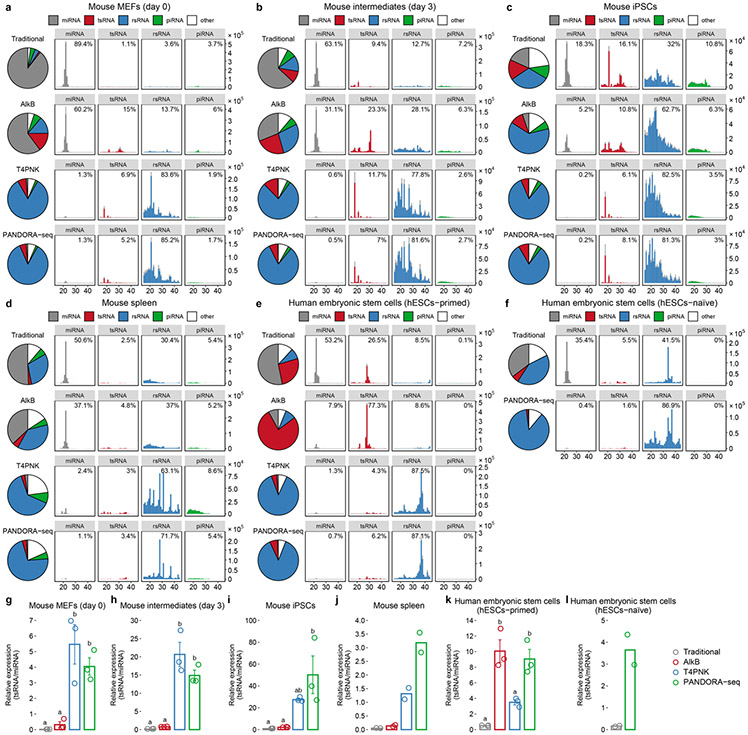
Extended Data Fig. 1 ∣. Reads summary and length distributions of different sncRNA category under Traditional RNA-seq, AlkB-facilitated RNA-seq, T4PNK-facilitated RNA-seq, and PANDORA-seq.
Showing Reads summary and length distributions of different sncRNA category in six tissue/cell types that are not shown in Fig. 3 because of space limitation. (a-c) Cells during mouse somatic cell reprogramming to iPSC: (a) MEFs (day 0), (b) intermediates (day 3), (c) iPSCs; (d) mouse spleen, (e) primed human embryonic stem cells (hESCs-primed), and (f) naïve human embryonic stem cells (hESCs-naïve) (g-l) the relative tsRNA/miRNA ratio under different protocols. for g,h,I,k, mean ± SEM, n=3 biologically independent samples in each bar; for j,l, n=2 biologically independent samples in each bar; different letters above bars indicate statistical difference, P < 0.05; same letters indicate P ≥ 0.05 (two-sided, one-way ANOVA, uncorrected Fisher’s LSD test). Statistical source data and the precise P values are provided in Source Data Extended Data Fig. 1.

