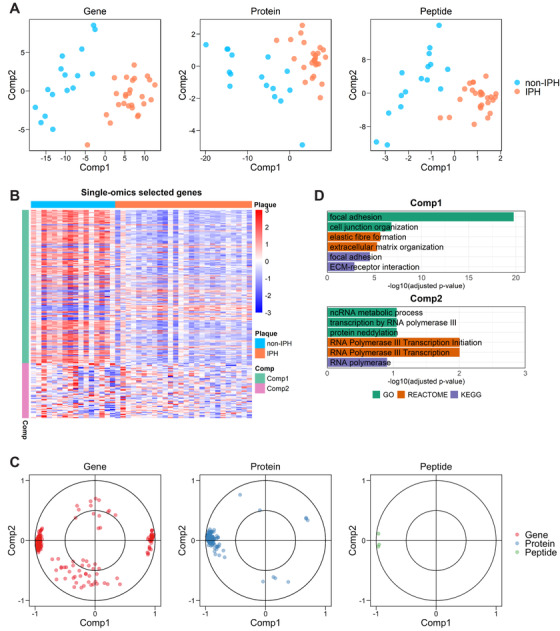
FIGURE 2.

Single‐omics sPLS‐DA on transcriptomics, proteomics, and peptidomics. (A) Two‐component sample distribution (16 non‐IPH and 26 IPH) for single‐omics sPLS‐DA on plaque transcriptomics (gene), proteomics (protein), and peptidomics (peptide), respectively. For visualization purpose, two components were included in the plot for peptidomics. (B) Heatmap shows expression level of the selected genes (comp1, n = 150; comp2, n = 54) from transcriptomics. Expression values were z‐normalized per row. (C) Selected features by single sPLS‐DA on the three omics are plotted, respectively (n = 204 for genes; n = 111 for proteins; n = 3 for peptides), according to their Pearson's correlation coefficient to the components 1 and 2. (D) GSOA on standardized gene set of single sPLS‐DA. For each component, six highly ranked overrepresented terms are selectively shown
