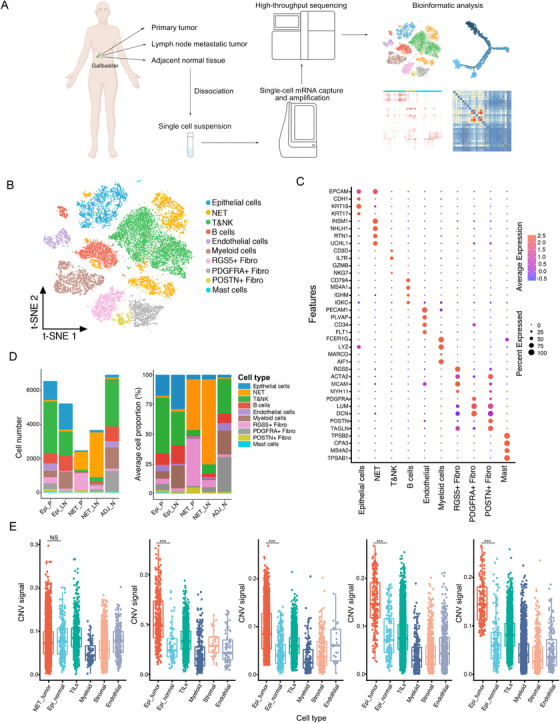
FIGURE 1.

Distinct cell types in GC and the adjacent normal tissues identified through integrating single‐cell transcriptomic data. (A) Overview of the study design, sample collection, single cell preparation, sequencing, and bioinformatic analysis. (B) The t‐SNE plot identified 10 main cell types in GC and adjacent normal tissue. Resolution used for t‐SNE cell grouping analysis is 2.5. (C) The dot plot of the expression level of representative well‐known biomarkers across distinct cell types. The x‐axis indicated distinct cell subtypes and the y‐axis indicated specific biomarkers of each cell subgroup. (D) The number (left) and average proportion (right) of assigned cell types in different tissue types were presented. The color panel indicated different cell subgroups in the scRNA‐seq data (Epi_P, n = 4; Epi_LN, n = 3; NET_P, n = 1; NET_LN, n = 1; ADJ_N, n = 3). (E) Boxplot showing distributions of CNV scores among different cellular types in gallbladder tissues from patient SC128, SC110, SC133, SC144, and SC146, respectively. *** p < 0.001 for Wilcoxon test (two‐tailed). NS, no significance. Epi_P, primary epithelial (adenocarcinoma or squamous) tumor tissue; Epi_LN, lymph node metastatic epithelial (adenocarcinoma or squamous) tumor tissue; NET_P, primary neuroendocrine tumor; NET_LN, lymph node metastatic neuroendocrine tumor; ADJ_N, adjacent normal tissue
