FIGURE 2.

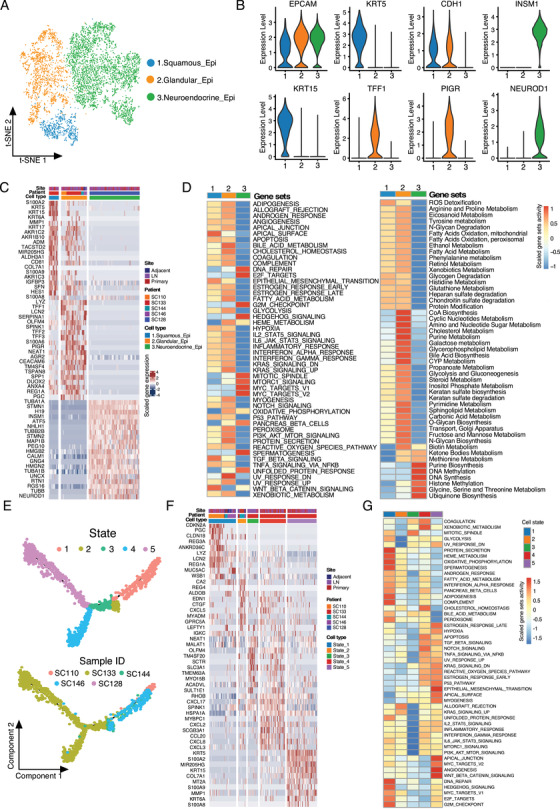
Cellular heterogeneity within the gallbladder epithelial and neuroendocrine tumor cells. (A) The t‐SNE plot of the EPCAM+ cells identified three major cell clusters including squamous, glandular, and neuroendocrine epithelial cells. Resolution used for t‐SNE cell grouping analysis 1.2. (B) Violin plots showing the expression levels of biomarkers in the three major cell clusters identified in A. (C) Heatmap of the top 20 differentially expressed genes (based on Wilcoxon test) for each EPCAM+ cell subgroup. (D) The competitive GSEA analysis of the hallmark gene sets (left) and metabolic activity gene sets (right) between the cell subgroups. (E) Monocle 2 trajectory analysis of the epithelial cells derived from GC and adjacent normal tissues annotated by the cellular state (upper) and patient ID (lower). (F) The top 10 differentially expressed genes (based on Wilcoxon test) between the cell state in (E). (G) The competitive GSEA analysis of the hallmark gene sets between the cell subgroups in (E)
