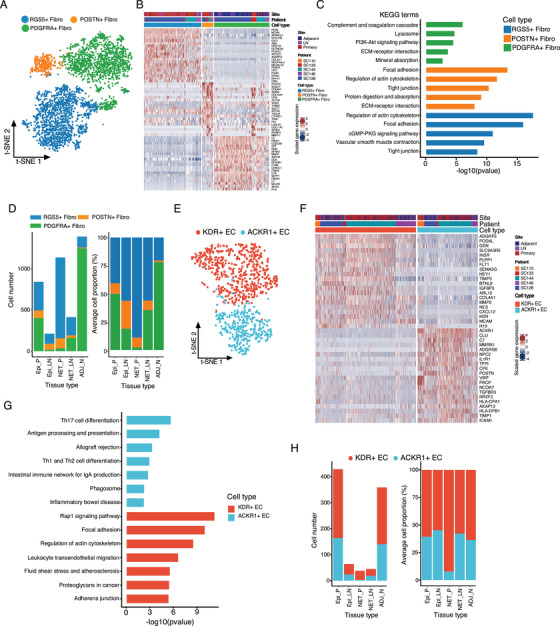
FIGURE 6.

Subclusters analysis of stromal cells in gallbladder tissues. (A) t‐SNE plot of the distinct stromal cell clusters was shown, colored by the identified cell subgroups. Resolution used for t‐SNE cell grouping analysis is 1.0. (B) The top 20 differentially expressed genes (based on Wilcoxon test) between the fibroblast groups. (C) KEGG enrichment analysis of the differentially expressed genes in distinct fibroblast groups. (D) The total cellular number (left panel) and average proportion (right panel) of the three main stromal cells in different tissue types were shown. (E) The t‐SNE plot of endothelial cells was shown, colored by the cell subgroups as indicated. Resolution used for t‐SNE cell grouping analysis is 1.0. (F) The top 20 differentially expressed genes between the two identified endothelial cell subclusters. (G) KEGG enrichment analysis of the differentially expressed genes in in KDR+ or ACKR1+ endothelial cells. (H) The total identified cell number and proportion of different endothelial cells in different tissue types was shown. Epi_P, primary epithelial (adenocarcinoma or squamous) tumor tissue; Epi_LN, lymph node metastatic epithelial (adenocarcinoma or squamous) tumor tissue; NET_P, primary neuroendocrine tumor; NET_LN, lymph node metastatic neuroendocrine tumor; ADJ_N, adjacent normal tissue
