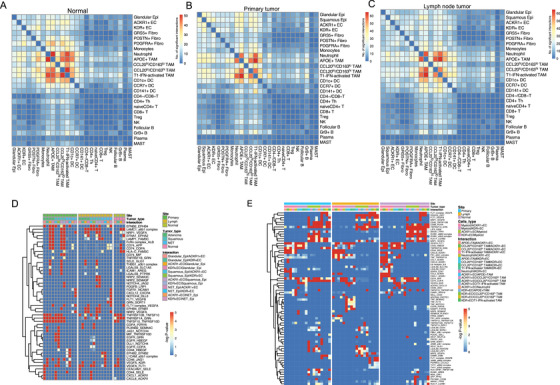
FIGURE 7.

Intercellular ligand–receptor interactions in GC tissues. (A–C) Heatmap depicting the significant ligand–receptor cellular interactions in the normal tissues (A), primary epithelial tumors (B), and lymph node metastatic tissues (C). (D) Heatmap depicting the significant ligand–receptor interactions among gallbladder epithelial malignant/nonmalignant cells, neuroendocrine tumor cells, and endothelial in different tissue types. (E) Heatmap depicting the significant ligand‐receptor interactions between myeloid cells and endothelial in distinct tissue types
