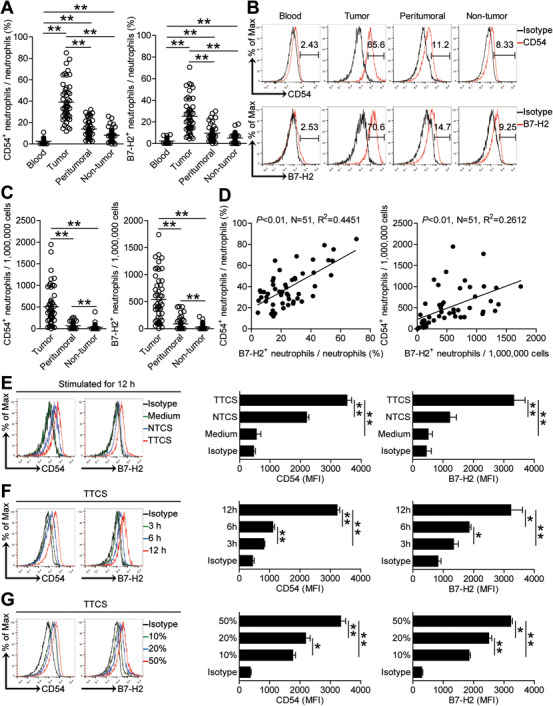
FIGURE 3.

Human GC environments induce neutrophil activation and B7‐H2 expression. (A and C) Statistics analysis of CD54+ neutrophil percentage and B7‐H2+ neutrophil percentage in total neutrophils (A) and the number of CD54+ neutrophils and B7‐H2+ neutrophils per million total cells (C) in each samples of patients with GC by gating on CD45+CD11b+CD66b+CD15+CD54+ cells and CD45+CD11b+CD66b+CD15+B7‐H2+ cells and counting (n = 51). (B) Expression of molecule CD54 and B7‐H2 on neutrophils. Color histograms represent staining of CD54 and B7‐H2; black, isotype control. (D) The correlations between CD54+ neutrophils and B7‐H2+ neutrophils in human tumors were analyzed. Results are expressed as the percentage of CD54+ neutrophils and B7‐H2+ neutrophils in total neutrophils or the number of CD54+ neutrophils and B7‐H2+ neutrophils per million total cells in tumor tissues. (E) Representative data and statistical analysis of the expression of CD54 and B7‐H2 on neutrophils of healthy donors exposed to 50% autologous TTCS and NTCS for 12 hours (n = 3). black, isotype control. (F) Representative data and statistical analysis of the expression of CD54 and B7‐H2 on neutrophils exposed to 50% TTCS for 3, 6, 12 h (n = 3). black, isotype control. (G) Representative data and statistical analysis of the expression of CD54 and B7‐H2 on neutrophils exposed to 10%, 20%, 50% TTCS for 12 h (n = 3). black, isotype control. The horizontal bars in panels A or C represent mean values. Each ring or dot in panels (A, C, or D) represents one patient. MFI: mean fluorescence intensity. *P < 0.05; **P < 0.01 for groups connected by horizontal lines
