
FIGURE 4.
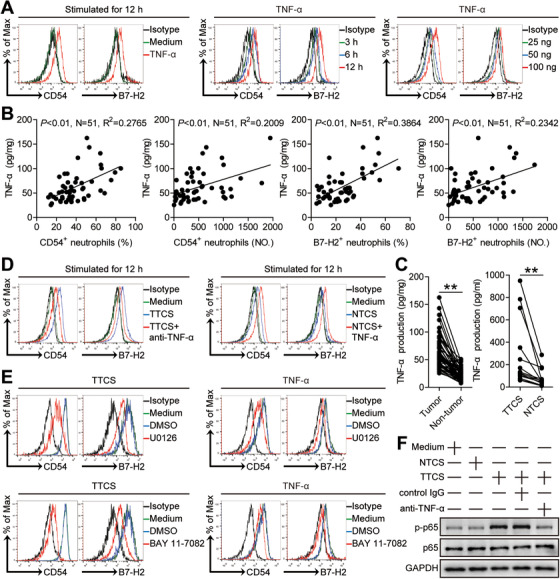
Tumor‐derived TNF‐α activates neutrophils and induces B7‐H2 expression on neutrophils via ERK‐NF‐κB pathway. (A) Expression of CD54 and B7‐H2 on neutrophils exposed to TNF‐α (100 ng/ml) or medium control for 12 h, or exposed to TNF‐α (100 ng/ml) for 3, 6, 12 h, or exposed to TNF‐α (25, 50, or 100 ng/ml) for 12 h. black, isotype control. (B) The correlations between TNF‐α and CD54+ neutrophils or B7‐H2+ neutrophils in human tumors were analyzed. Results are expressed as the percentage of CD54+ neutrophils and B7‐H2+ neutrophils in total neutrophils or the number of CD54+ neutrophils and B7‐H2+ neutrophils per million total cells and TNF‐α concentration in tumor tissues. (C) TNF‐α concentration between autologous tumor and non‐tumor tissues (n = 51) or between autologous TTCS and NTCS (n = 14) was analyzed. (D) Expression of CD54 and B7‐H2 on neutrophils exposed to TTCS with anti‐TNF‐α antibody or NTCS with TNF‐α for 12 h. (E) Expression of CD54 and B7‐H2 on neutrophils exposed to TTCS or TNF‐α with or without U0126 (an ERK inhibitor) or BAY 11‐7082 (an IκBα inhibitor) for 12 h. black, isotype control. (F) The p65 and p‐p65 proteins in neutrophils exposed to autologous TTCS, NTCS, or TTCS with anti‐TNF‐α antibody or control IgG for 12 h were analyzed by western blot. Each dot in panel (B) or (C) represents one patient. **P < 0.01 for groups connected by horizontal lines