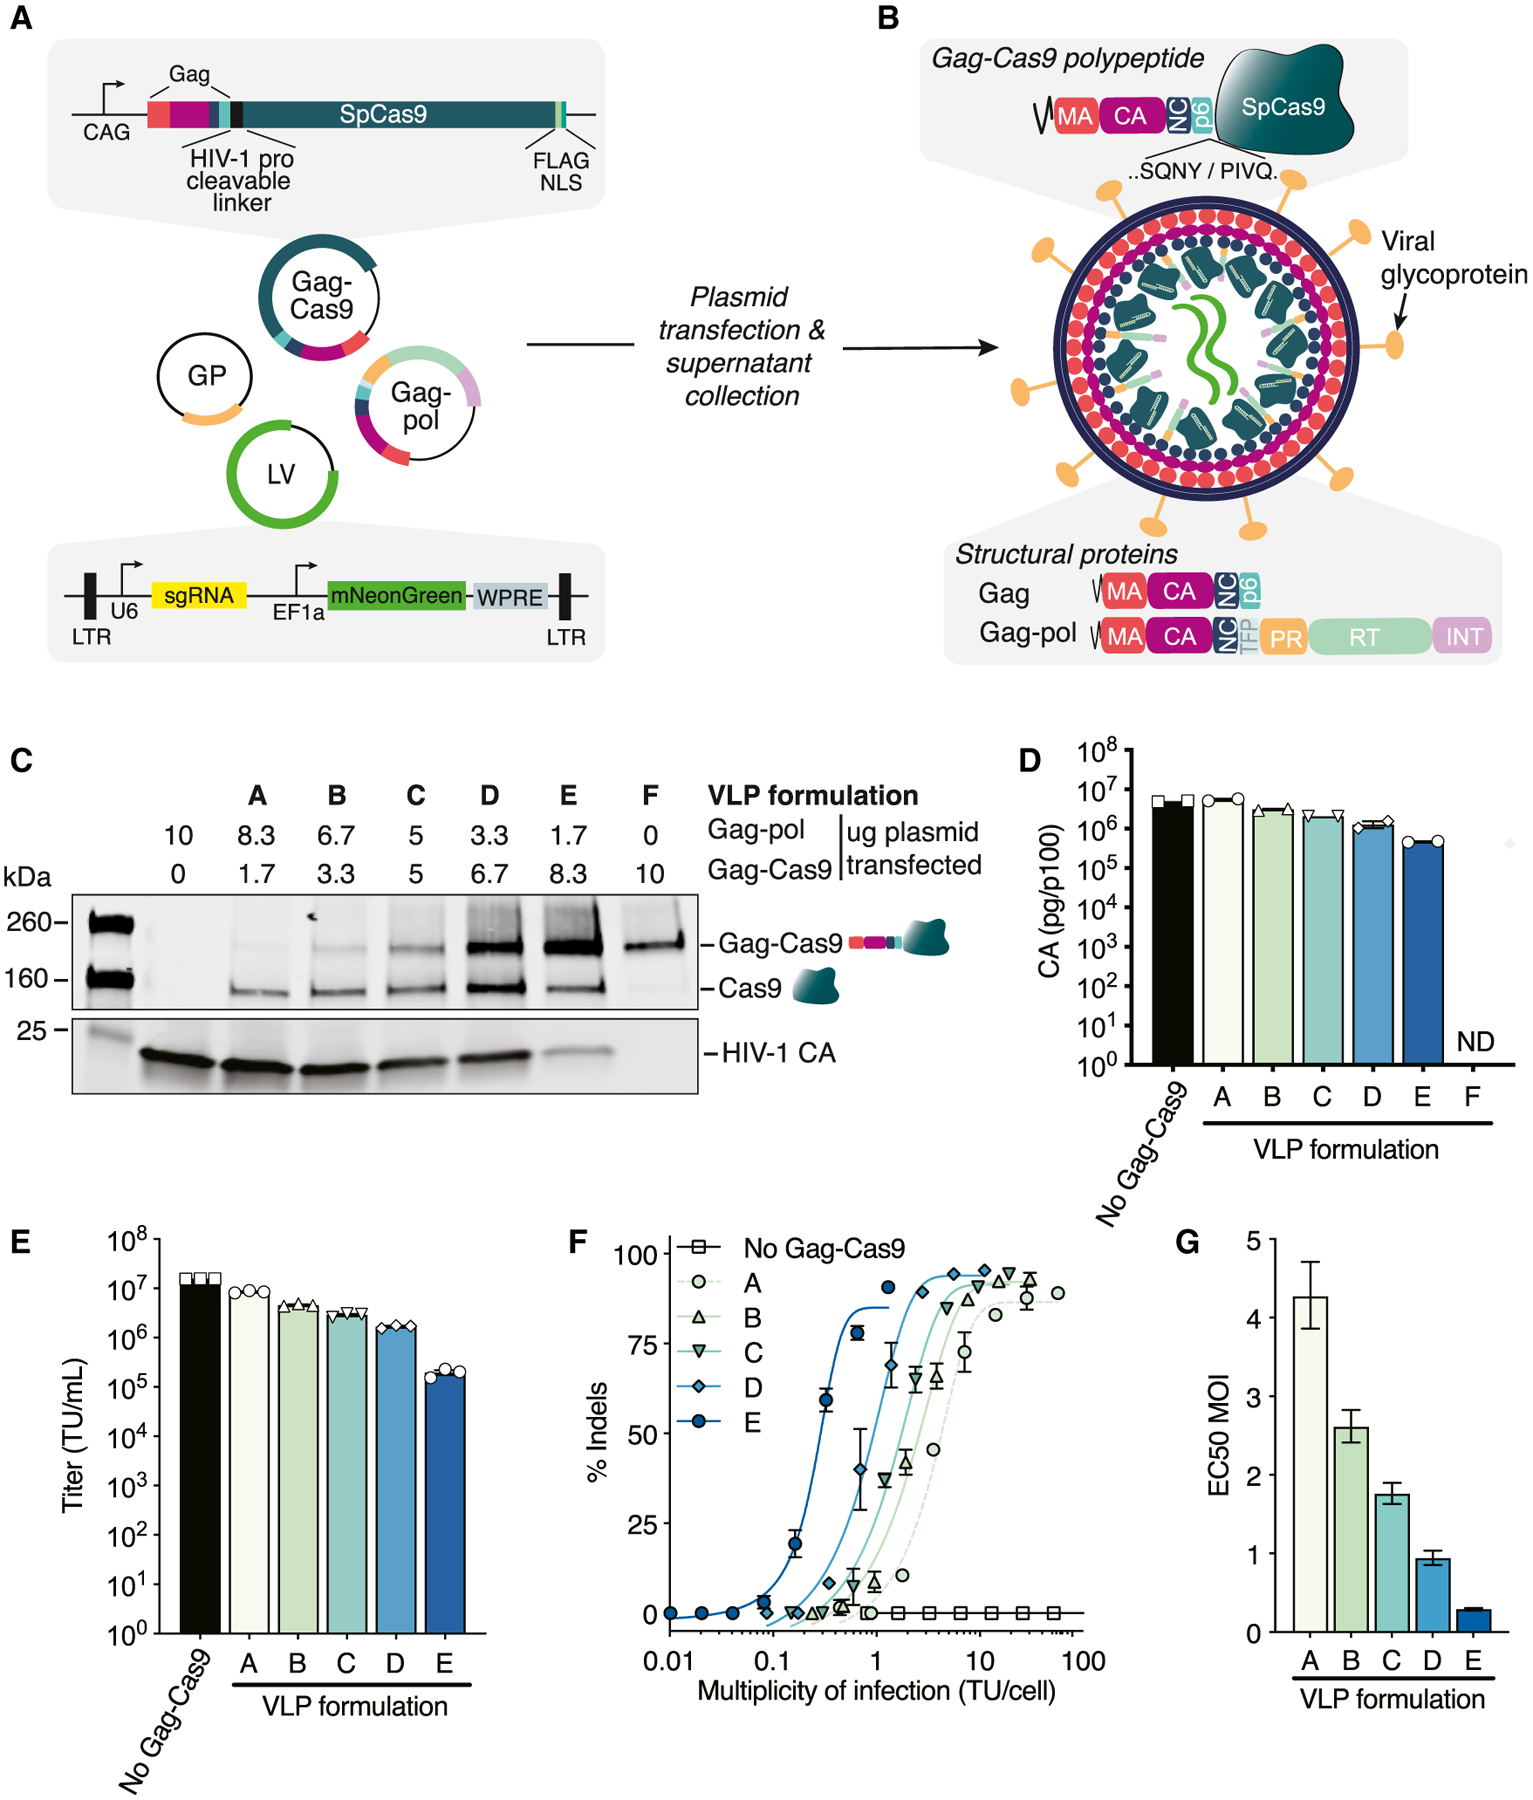
Figure 1. Production and characterization of Cas9-VLPs.

(A) Schematic of plasmids for Cas9-VLP production. GP, glycoprotein; LTR, long terminal repeat; LV, lentiviral transfer plasmid.
(B) Schematic of an immature Cas9-VLP produced through transient transfection. An HIV-1 protease cleavable linker (SQNYPIVQ) was inserted between Gag and Cas9.
(C) Western blot of Cas9-VLP content with various ratios of Gag-pol and Gag-Cas9 plasmids used for production. Anti-FLAG (Cas9) and anti-p24 (capsid, CA) antibodies were used for detection.
(D) Quantification of Cas9-VLPs produced per transfected p100 dish by CA ELISA; n = 2 technical replicates.
(E) Jurkats were treated with B2M-targeting Cas9-VLPs and the transducing units (TUs) per milliliter titer was calculated.
(F) Percentage of B2M indels plotted against the multiplicity of infection (MOI) using a sigmoidal 4-parameter logistic fit. Indels were quantified using Synthego’s ICE analysis tool.
(G) The predicted MOI for each Cas9-VLP formulation to achieve 50% indels, interpolated from (F). EC50, effective concentration at which a drug gives a half-maximal response.
n = 3 technical replicates (E and F), except for formulation A (n = 2) (F). Error bars indicate standard error of the mean (D–F) and 95% confidence interval (G). ND, not detected.
