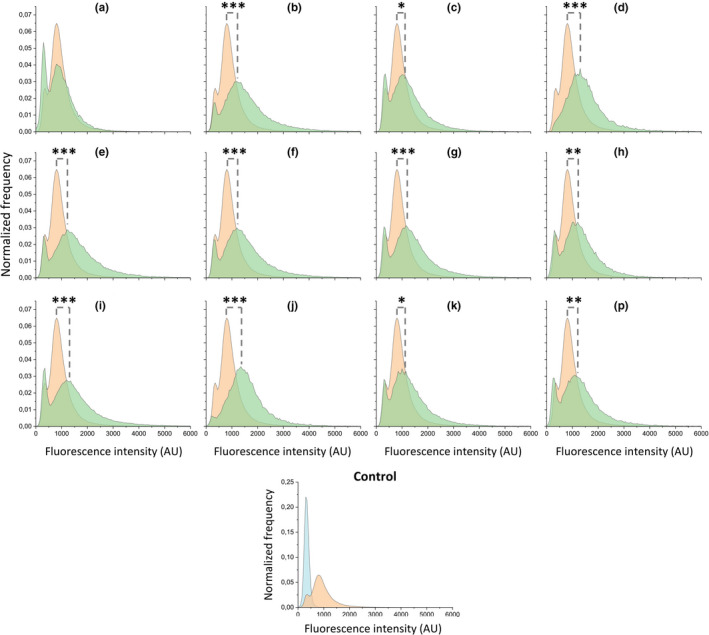
FIGURE 1.

Expression of the tapA‐sipW‐tasA operon in Bacillus subtilis WT and ∆rap‐phr mutants after growth in MSgg under shaking conditions. Flow cytometry analysis showing the average distributions of GFP expression of ∆rap‐phr mutants and WT harboring the PtapA‐gfp construct (n = 3–8). The average WT distribution is shown in each graph for comparison. Orange = WT, green = mutant, blue = non‐labelled control strain. Letters denote the corresponding ∆rap‐phr mutants, that is, a = ∆rapA, b = ∆rapB and so forth. AU indicates arbitrary units. The significant difference in the mean fluorescence intensity of the ON population (GFP values between 500 and 10,000) between mutants and WT were tested by an ANOVA followed by Dunnett's multiple comparison test. *p < 0.05, **p < 0.01, ***p < 0.001
