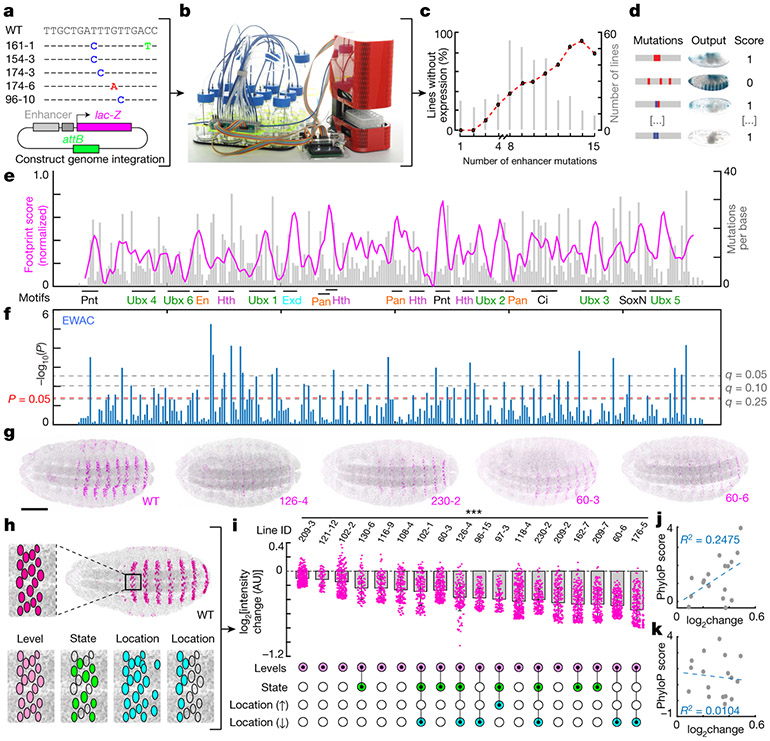
Fig. 1 ∣. Most nucleotide mutations in E3N alter gene expression.
a, Subset of E3N mutagenesis library and schematic of the reporter construct used for integration of enhancers into the Drosophila genome (Extended Data Fig. 1). b, The liquid-handling robot (Extended Data Fig. 2). c, Percentage of lines with no expression plotted against number of mutations per line. d, Lines were scored as 1 (positive) or 0 (no visible expression defects; see Methods). e, Footprinting scores plotted along the E3N sequence. Magenta line, footprinting score (σi, see Methods). Higher peaks show a higher probability that a mutation will change expression. Grey histogram, number of mutations per base for the screened lines (Mi, see Methods). f, EWAC scores represent P values (t-test, two-tailed) from a log of odds ratio test for the association of a mutation with changing expression (see Methods). g, Examples of fly embryos with single-mutant E3N::lacZ reporter constructs. WT, wild-type; numbers are line ID numbers. h, Schematic of possible changes to expression outputs. i, Top, nuclear intensity changes associated with single mutations compared to wild-type E3N (n = 212 nuclei; 8 embryos). Mean ± s.d.; ***P < 0.01, two-tailed t-tests. See Methods for sample sizes. AU, arbitrary units of fluorescence intensity. Bottom, Changes in expression output for the single mutations (Extended Data Fig. 3). j, k, Pearson correlations between mutation effect sizes and PhyloP scores for 27 (j) and 124 species (k) with least squares linear regression, and R2 values. g, Scale bar, 100 μm; embryo in h matched for scale.

