. 2021 Jun 17;62(7):650–659. doi: 10.3349/ymj.2021.62.7.650

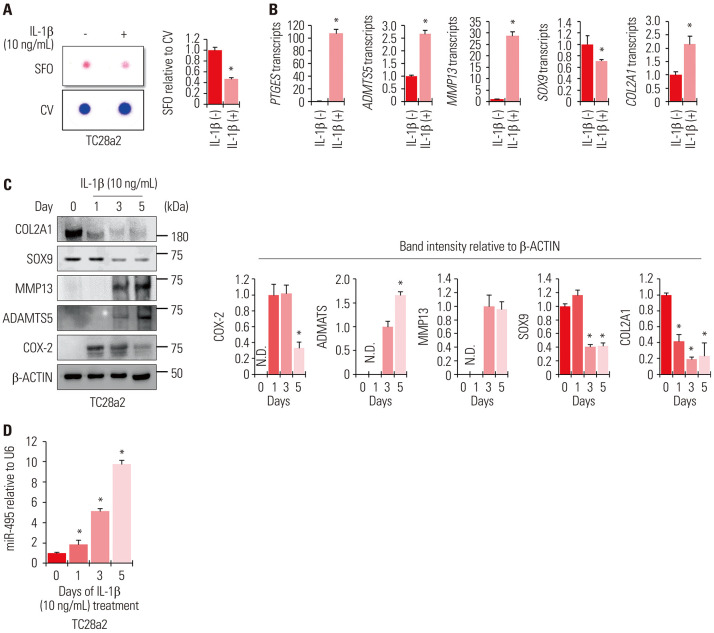
Fig. 1. miRNA-495 is upregulated during osteoarthritis progression in an in vitro model generated using the human normal chondrocyte cell line TC28a2. (A) TC28a2 cells were seeded at 1×10⁵ cells per well in 24-well culture plates. The cells were treated with 10 ng/mL of IL-1β or with no IL-1β as a control. Safranin O staining was performed to detect glycosaminoglycans (GAGs). Stained cells were destained with 10% cetylpyridinium for quantitative analysis. Absorbance was measured at 490 nm. *p<0.05 compared to the control groups (n=3 experimental replicates). (B) The graphs represent the results of quantitative real-time polymerase chain reaction (qRT-PCR) using RNA extracted from TC28a2 cells that were treated with 10 ng/mL of IL-1β or with no IL-1β as a control (n=3 experimental replicates). The expression levels of all transcripts tested were normalized to those of 18S rRNA. The data are presented as means±SD. *p<0.05 compared to the IL-1β (−) groups. (C) Protein levels of SOX9, COL2A1, COX-2, ADAMTS5, and MMP13 were analyzed in TC28a2 cells using Western blotting, and the proteins were isolated on days 0, 1, 3, and 5 after treatment with 10 ng/mL of IL-1β. The graphs represent the average values of band intensity for each blot, and each blot was normalized to the band intensity value of β-actin (n=3 experimental replicates). The data are presented as means±SD [COX-2 (*p<0.05 vs. Day 1), ADAMTS5 (*p<0.05 vs. Day 3), SOX9 and COL2A1 (*p<0.05 vs. Day 0)]. (D) The graphs represent the results of qRT-PCR using RNA extracted from TC28a2 cells treated with 10 ng/mL of IL-1β or with no IL-1β as a control (n=3 experimental replicates). The expression levels of miR-495 were normalized to those of U6. The data are presented as means±SD. *p<0.05 vs. Day 0. IL-1β, interleukin-1β; SFO, safranin O; CV, crystal violet; ND, not detectable.

Fig. 1